Plotting antiprion compounds in the chemical space of drugs and libraries
introduction
Recently I’ve reviewed antiprion high-throughput screens, learned a few basics of cheminformatics, gotten a list of CNS drugs, and compared the chemical space of CNS drugs vs. all drugs. The goal of the present post is to examine how well 1) known antiprion compounds and 2) chemical libraries screened for antiprion compounds overlap with the chemical space of drugs generally and CNS drugs specifically.
antiprion compounds
Over a hundred of compounds have been reported to inhibit prion replication in cell culture or to extend survival in animal models. I’ve now reviewed most of the reported in vivo experiments here. Many of the compounds studied have indirect mechanisms of action – see for instance statins, rapalogues and other autophagy activators, PERK inhibitors, and so on – and some of these do and some do not affect prion replication. In this post, however, I am interested in the most potent anti-prion compounds – small molecules which can abolish prion replication almost completely, at least for a little while. Some of these are highly effective in vivo, while others are not due to their toxicity, pharmacokinetics, or drug resistance issues, but all (as far as I know) have a well-replicated strong effect at least in cell culture. The mechanism for some of these is not known (e.g. amphotericin b), but as far as is known, most of these seem to bind either to PrPC or to PrPSc. Below is the (non-exhaustive) list I came up with, and here is a tab-delimited file with SMILES for all these. For new compounds still in the lead development stage (for instance Li 2013a, Li 2013b) I just chose one representative compound.
| compound name | citation |
|---|---|
| amphotericin b | Pocchiari 1987 |
| anle138b | Wagner 2013 |
| arylamide 17 | Li 2013b |
| arylpiperazine 41 | Li 2013a |
| chloroquine | Doh-Ura 2000 |
| chlorpromazine | Korth 2001 |
| congo red | Caughey & Race 1992 |
| cpd-b | Kawasaki 2007 |
| curcumin | Caughey 2003 |
| dextran sulfate | Ehlers & Diringer 1984 |
| DOSPA | Winklhofer 2000 |
| E-64 | Doh-Ura 2000 |
| E-64d | Doh-Ura 2000 |
| heparin | Caughey & Raymond 1993 |
| IND24 | Berry 2013 |
| leupeptin | Doh-Ura 2000 |
| pentosan polysuflate | Doh-Ura 2004 |
| phthalocyanine tetrasulfonate | Priola 2000 |
| quinacrine | Doh-Ura 2000 |
| suramin | Doh-Ura 2000 |
| thienyl pyrimidine A6 | Ayrolles-Torro 2011 |
| tilorone | Doh-Ura 2000 |
chemical libraries
I went to ZINC in search of the compound lists for chemical libraries that have been used in antiprion high-throughput screens. Two were easy to find: the MSDI US Drug Collection and MSDI Spectrum Collection. The others were more difficult. Prusiner’s group has published a screen of 10,135 compounds [Ghaemmaghami 2010] that appear to have been a subset of the 50,000-compound ChemDiv “Diversity Collecton” maintained at UCSF’s Small Molecule Discovery Center (SMDC). I was able to get data on all 50,000 compounds from ZINC’s entry for SMDC ChemDiv Diversity, but wasn’t able to determine which 10,135 were screened, so I included all 50,000 in this analysis. Armin Giese’s group has screened DIVERSet 1 & 2, two 10,000-molecule subsets of the overall ChemBridge DIVERSet collection. I couldn’t even find a list of the DIVERSet compounds, let alone the specific DIVERSet 1 & 2 subsets, so I downloaded the whole ChemBridge library annotations and selected a random subset of 20,000 of them (for speed).
mapping chemical space
Inspired by [Singh 2009], I set out to use rcdk to calculate chemical properties on these molecules and then reduce dimensionality with a principal components analysis. My analysis used the same six chemical properties as [Singh 2009]: MWT, NRB, tPSA, LogP, HBA, and HBD (see this post for definitions), plus one other property – net charge. For the compound libraries, I actually started from the SMILES in the “Properties” files in ZINC, but re-calculated all the properties to make sure I didn’t get batch effects driving differences between these and the other compounds I wanted to compare them to. The core of this is pretty much my code from this post with minor modifications.
Here is the whole R script used for this post. Most of it isn’t that exciting, so I’ll only include a few choice snippets directly in the post.
results
I created one combined dataset of all FDA-approved drugs including CNS drugs (from DrugBank via this post), plus the antiprion compounds listed above plus some or all of the contents of four chemical libraries screened to discover antiprion compounds. I calculated 7 chemical properties and found that principal components 1 and 2 together explained 99.9% of variance in the compounds’ properties.
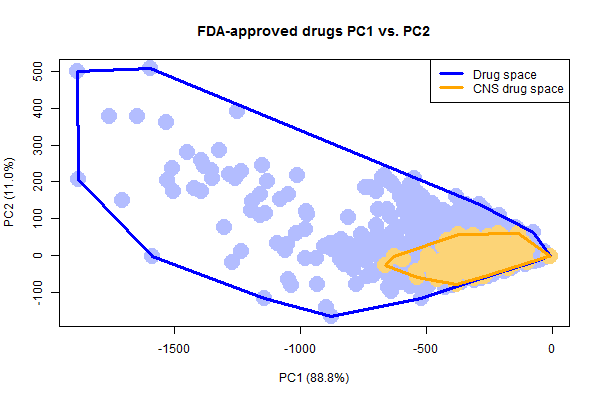
Plotting just the drugs and CNS drugs, it’s easy to see how the CNS drugs occupy a smaller space than all drugs do.
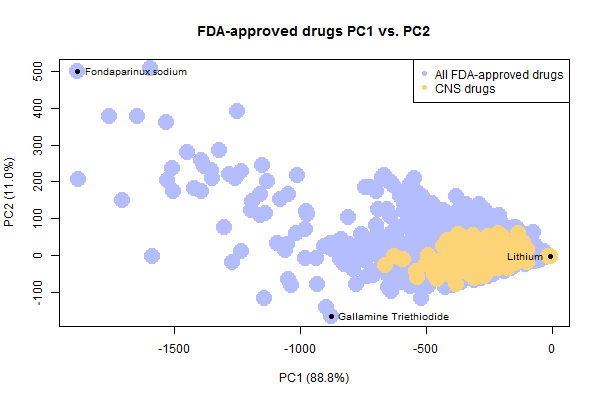
It’s also notable that there are a few weird, not-very-drug-like outliers in the set of FDA-approved drugs. I’ve highlighted three outliers above. To draw these molecules, I had to write a quick bit of R code to solve the problem that rcdk cannot plot disconnected molecules. This happens with drugs sold as a salt, where the ions are portrayed as separate molecules separated by a . in the SMILES. To get and plot the drug itself, I simply split each SMILES string on periods and take the longest substring:
# rcdk cannot plot disconnected molecules (e.g. w/ ionic bonds)
# so this function will strip away the smaller disconnected parts
stripsmiles = function(smiles) {
  parts = strsplit(smiles,"\\.")[[1]]
  longestpart = parts[which(nchar(parts)==max(nchar(parts)))]
  return(longestpart)
}
With that done, here’s what the three outliers denoted above look like:
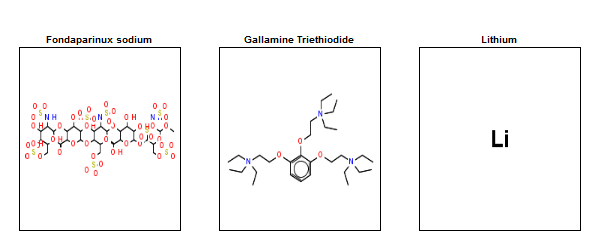
Lithium, with a molecular weight of just 7, is by far the smallest drug. Fondaparinux (an anticoagulant), on the other end of the spectrum, is preposterously large and complex. No one is going to try to discover new drugs this complex. In fact, I always thought that big molecules like this only became drugs serendipitously because they were derived from natural products, whereas no one would actually set out to synthesize such a monster. However, when I searched I learned that fondaparinux is actually synthetic, not natural – Sanofi’s synthesis pathway contains 50 steps and a recent publication has whittled this down to a new pathway with “only” 36 steps and a yield of .017% [Lin 2013].
In fact, the above plot actually understates how extremely large and weird many approved drugs are. For instance, DrugBank represents the glycosaminoglycan heparin (an antiprion compound and also an approved drug) as a tetramer, when in fact it’s a heterogeneous polymer of many more than 4 subunits – typical molecular weight in preparations used pharmaceutically runs from 3 to 30 kDa. The principal components plot above is based on molecular weights and other properties calculated from the SMILES, which for many such compounds represents just one or a few units, not the huge polymer used in practice.
The take-home is, the chemical space of currently approved drugs is actually much larger than the space in which one would want to look for new drugs.
That point is driven home by a comparison of the principal component space of the libraries versus that of drugs.
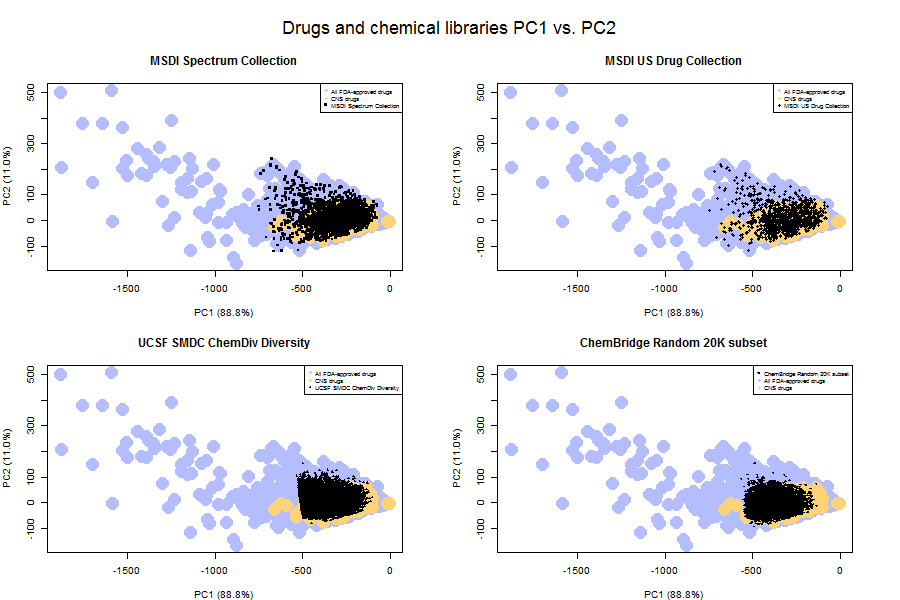
As you can see, even the MSDI US Drug Collection (upper right) doesn’t include all FDA-approved drugs. It includes only the small ones. And the diversity libraries (bottom row) occupy an even smaller principal component space – they’re even more selected for desirable drug-like properties.
In fact, you can see that the UCSF ChemDiv set has a pretty sharp cutoff along PC1 (which mostly captures size). This suggested to me that the folks at the UCSF Small Molecule Discovery Center have imposed a strict molecular weight cutoff for inclusion in libraries. Plotting histograms of molecular weight for each library confirmed this:
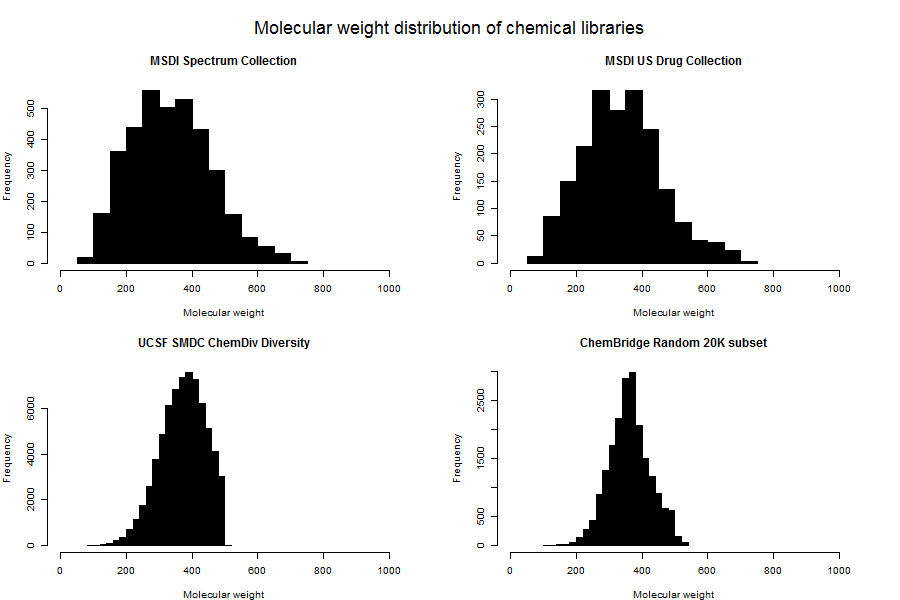
SMDC (bottom left) includes no molecules of > 500 Da. ChemBridge (lower right) is pretty heavily filtered for lower molecular weight compounds too, though it’s not as sharp a dropoff.
Going back to my finding that the chemical libraries occupy only a subset of the drug principal component space, note that this result is quite different from the situation examined in [Singh 2009]. Singh looked at four chemical libraries and found only modest overlap with the drug space. Singh also found that the first two PCs explained only 84% of variance, compared to 99.9% here. Unfortunately I couldn’t find those four chemical libraries in ZINC to check whether my pipeline would replicate Singh’s result. However, I based my analysis on the same chemical properties as Singh (plus charge, but I re-ran my analysis without charge and got the same answer as reported here) so I’m reasonably sure that my result reflects the genuinely different content of these chemical libraries compared to those that Singh examined.
In other words, it looks like the folks who’ve screened for antiprion compounds have done a pretty good job of picking chemical libraries that are enriched for molecules that (at least in a very crude principal components analysis) fall squarely within the drug space.
To quantify that, I wanted to ask how many of the chemical library compounds are within (A) the drug space, and (B) the CNS drug space. I tackled this problem in two steps:
- Convert the point cloud of drugs into a polygon outlining the space. This meant calculating a convex hull using R’s
chullfunction. - For every compound in each chemical library, check whether it’s in the polygon via a point-in-polygon operation using R’s
splibrary’spoint.in.polygonfunction.
Here’s what the code looks like to generate and plot the convex hulls over the points themselves:
# plot the FDA and CNS drugs with their convex hulls
png('fda.cns.pc1.pc2.chulls.png',width=600,height=400)
# grab annotations
lib_annot = unique(all_annot[all_annot$cpdset %in% c('fda','fda_cns'),c('cpdset','desc','k','pch')])
# first plot empty
plot(NA,NA,xlim=range(cpddata$C1),ylim=range(cpddata$C2),xlab=paste('PC1 (',var_explained[1],')',sep=''),ylab=paste('PC2 (',var_explained[2],')',sep=''),
     main = "FDA-approved drugs PC1 vs. PC2",
     cex.main = 1.2)
# scatterplot the FDA-approved drugs
points(cpddata[cpddata$cpdset=='fda',"C1"],cpddata[cpddata$cpdset=='fda',"C2"],pch=19,cex=3,col=cpddata$k[cpddata$cpdset=='fda'])
# scatterplot the CNS drugs
points(cpddata[cpddata$cpdset=='fda_cns',"C1"],cpddata[cpddata$cpdset=='fda_cns',"C2"],pch=19,cex=3,col=cpddata$k[cpddata$cpdset=='fda_cns'])

# find convex hull for all drugs
drug_pts = cpddata[cpddata$cpdset %in% c('fda','fda_cns'),]
drug_chull_idx = chull(drug_pts$C1,drug_pts$C2)
points(drug_pts[drug_chull_idx,"C1"],drug_pts[drug_chull_idx,"C2"],type='l',lwd=3,col='blue')

# find the convex hull of the CNS drugs
cns_pts = cpddata[cpddata$cpdset=='fda_cns',]
cns_chull_idx = chull(cns_pts$C1,cns_pts$C2)
points(cns_pts[cns_chull_idx,"C1"],cns_pts[cns_chull_idx,"C2"],type='l',lwd=3,col='orange')

# legend
legend('topright',c("Drug space","CNS drug space"),col=c('blue','orange'),lwd=3)

dev.off()
And here’s the code to loop through each chemical library and quantify the number of its compounds that fall within each hull:
# table to hold convex hull results
chtable = data.frame(cpdset=character(),desc=character(),cns_frac=numeric(),drug_frac=numeric())
# now compute fraction within the CNS polygon for all libraries
for (chemlib in all_annot$cpdset) {
  in_cns = point.in.polygon(cpddata[cpddata$cpdset==chemlib,"C1"],
                            cpddata[cpddata$cpdset==chemlib,"C2"],
                            cns_pts[cns_chull_idx,"C1"],
                            cns_pts[cns_chull_idx,"C2"])
  in_drugs = point.in.polygon(cpddata[cpddata$cpdset==chemlib,"C1"],
                              cpddata[cpddata$cpdset==chemlib,"C2"],
                              drug_pts[drug_chull_idx,"C1"],
                              drug_pts[drug_chull_idx,"C2"])
  temp1 = cbind(chemlib,
                all_annot$desc[all_annot$cpdset==chemlib],
                sum(in_cns > 0)/length(in_cns),
                sum(in_drugs > 0)/length(in_drugs))
  names(temp1) = c('cpdset','desc','cns_frac','drug_frac')
  chtable = rbind(chtable,temp1)
}
Here’s a barplot of the results:
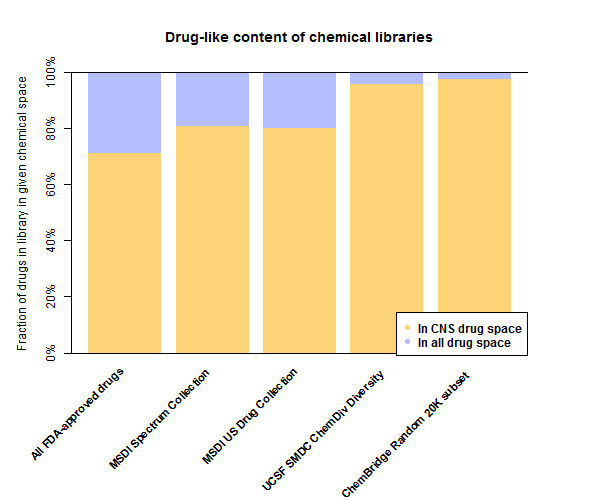
Or for those who prefer tables over barplots:
| Library | In CNS drug space | In drug space |
|---|---|---|
| All FDA-approved drugs | 71% | 100% |
| MSDI Spectrum Collection | 81% | 99% |
| MSDI US Drug Collection | 80% | 100% |
| UCSF SMDC ChemDiv Diversity | 96% | 100% |
| ChemBridge Random 20K subset | 97% | 100% |
Surprisingly to me, 71% of all FDA-approved drugs fall within the principal component space of the 221 CNS drugs. Of course, that doesn’t mean all 71% of those actually cross the blood-brain barrier, it just sort of means they don’t have any really obvious red flags (high molecular weight, high hydrophilicity) that show up in the principal components.
In comparison, all of the chemical libraries screened here are even more enriched for potential CNS drug space. In the large libraries 96-97% of molecules are in the CNS drug convex hull. That’s an excellent starting point for finding potential antiprion drugs that could get into the brain. Indeed, the subsets of these libraries that were actually used in screens [Ghaemmaghami 2010, Bertsch 2005, Leidel 2011, Wagner 2013] may have been even more enriched.
On the flip side, it’s worth acknowledging that my CNS drug list could contain false positives that aren’t actually blood brain barrier permeable drugs. The true CNS drug space could be smaller than I’ve plotted here. However, I spot checked the left- and right-most outliers on PC1 – bromocriptine and lithium – and they are indeed CNS drugs.
Next I wanted to take a look at the known antiprion compounds. Here’s where they stack up on the PC plot:
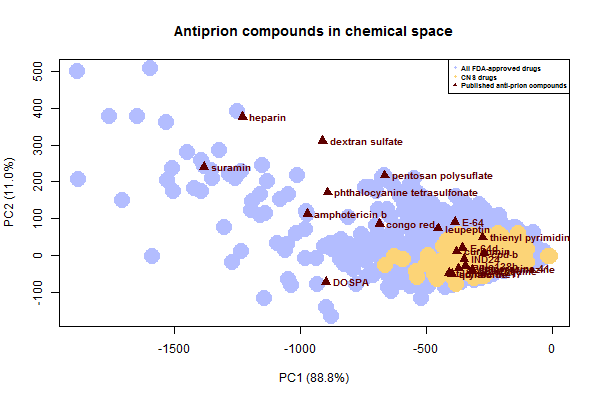
Notice that all of the sulfated glycans and anions fall way on the left, in the space where there are some existing FDA-approved drugs but no one is really looking for new drugs (no chemical libraries overlap). And again, this plot underestimates just how large these molecules really are – for instance, the SMILES I used for pentosan polysulfate is just a dimer.
It is likely that many if not all of these large compounds share a common mechanism, a possibility discussed long ago for some of them [Caughey & Raymond 1993]. Perhaps they antagonize PrP’s relationship with endogenous glycosaminogylcans. Phthalocyanine tetrasulfonate has been shown to bind PrPC [Dee 2012], and that may be true of several or all of the others here.
Now let’s zoom in on the cluster of antiprion compounds that fall within the CNS drug space:
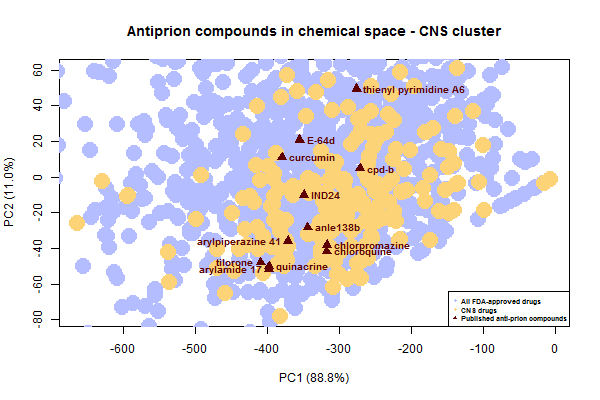
Do all of these compounds share a mechanism too? Many of them do, after all, look fairly similar to each other – flat, aromatic molecules of similar size. Treatment with IND24 causes prions to develop resistance to not only IND24 but also cpd-b and quinacrine [Berry 2013], suggesting at least those 3 share a mechanism. As far as I know, none of these compounds have been shown to bind PrPC, and some are specifically reported to interact only with oligomers, i.e. with PrPSc [Wagner 2013, Ayrolles-Torro 2011].
discussion
PrPC‘s C-terminal half is often described as a globular domain. (See Hafner-Bratkovic 2011 for some interesting experiments showing the requirement of “unlocking” this domain for prion conversion). In the very simplified “molten globule” model of protein folding, polypeptides form secondary structure and then, driven by the hydrophobic effect (the desire of adjacent water molecules for greater entropy) collapse with the hydrophobic residues at the center and hydrophilic residues pointed out. Therefore compounds that bind PrPC are relatively more likely to be hydrophilic in order to bind the available residues.
In contrast, PrPSc has long been described as “a hydrophobic protein” [Prusiner 1981]. It’s never been clear to me (though I imagine someone knows) what the driving force is behind PrPC → PrPSc conversion. Is it enthalpy, because the new bonds of oligomerization can let PrP reach a lower energy well? Or is it entropy / the hydrophobic effect, where caged water along an unfavorably exposed hydrophobic surface or PrPSc can be freed by the binding of yet another PrP molecule to the nascent oligomer?
If the latter, you could imagine a fundamental physical explanation for some of the current difficulties in anti-prion drug discovery. If you can bind PrPC you’re likely to have a drug that works across all prion strains, but the drug will probably have to be hydrophilic like PrPC is, and therefore won’t get into the brain. On the other hand, you can bind PrPSc‘s hydrophobic surface with a hydrophobic molecule that can get into the brain, but its binding might prove to be dependent on the particular conformation of PrPSc, meaning that it won’t work against all strains and that even the strains it does work on can develop resistance.
If this model is correct, you can imagine a few ways to optimize one’s chances of finding a good drug. The fact is, we need to be in the CNS drug space – that much is non-negotiable. So the options are 1) to find a drug in this space that binds PrPSc but somehow does so regardless of strain, or 2) to find a drug in this space that binds some more hydrophobic surface of PrPC.
There are probably ways to improve our odds of finding one of these things. Combining cell-free assays involving human prion strains with cell-based rodent prion strain assays in a cheminformatic meta-analysis (as was done in the lead-up to anle138b [Wagner 2013]) could help to find hydrophobic compounds that do bind PrPSc regardless of strain. Meanwhile, if there are any hydrophobic bindable surfaces of PrPC, then using libraries heavily enriched for small, hydrophobic potential CNS drugs (like those described here) in assays designed specifically to detect molecules that bind PrPC could discover ways to attack those.
I invite any comments on how accurate this model I’ve imagined is. I’m not well-read on the structural biology of prions and would appreciate pointers to relevant literature as well.

About Eric Vallabh Minikel
Eric Vallabh Minikel is on a lifelong quest to prevent prion disease. He is a scientist based at the Broad Institute of MIT and Harvard.