New expression pattern data access from the Allen Institute
Today I am attending a webinar hosted by the Allen Institute on how to access their data including several new things they’ve added. The most interesting thing so far is the availability of raw expression data by brain region, along with some visualization tools and gene correlation-finding tools.
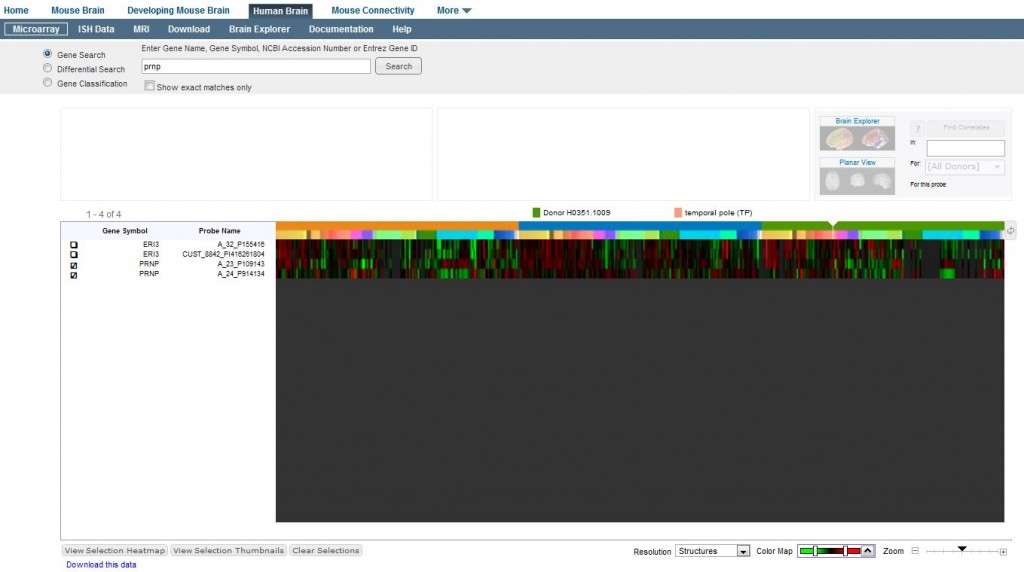
The Allen Institute has gene expression levels for all 20,000+ genes in the mouse and human genomes across brain regions in sagittal section. You can view the actual images created by in situ hybridization, as mentioned in a previous post. What I didn’t realize is you can also view heat maps of absolute or relative gene expression level across tissues for one or more genes. Visit, for instance:
The “color map” control in the lower right does more than just change the color spectrum– it also controls whether you are viewing normalized data (z-score of a given gene’s expression in each tissue relative to all tissues, as I understand it) or absolute data (log2 of actual measured expression level). Once you’re looking at the data you’re interested in, you can use the “Download this data” link in the lower left to get a zip file with csvs of the numbers behind the heatmap.
A few other neat things:
- The “Find Correlates” button in the upper right will find other genes that have an expression pattern similar to the probe you’ve selected, and fill your heat map with those. (The number “r” it gives you for each gene is the Pearson’s correlation).
- You can use “Differential Search” (upper left) to specifically find genes whose expression level is enhanced in a target brain region as compared to a contrast brain region. So, say you want to find genes more highly expressed in the thalamus than in the cerebral cortex. This would do that.
- You can use the “Gene Classification” (upper left) to find genes believed to be associated with a particular disease (though prion diseases are not in the list). Note: these gene classifications are from third party sources– Allen Institute did not create the gene classification lists nor are they based on any objective expression data collected by Allen Institute.
- After you click somewhere on the heat map it will show you details for that point above. If (like me) you’re not fluent in names of brain regions, you can click on the brain region in the “Structure” menu above left to open a new tab showing where that region sits in the brain region hierarchy.

