Biolit 09: genome-wide approaches
These are my notes for week 09 of Harvard’s BBS 230 “Analysis of the biological literature” course (November 11-13, 2014). This includes my own reading and analysis of the papers, as well as my notes from both discussion sections.
The papers for this week are [Kaida 2010] and [Ingolia 2011].
Kaida 2010: U1 snRNP protects pre-mRNAs from premature cleavage and polyadenylation
Background
snRNPs (“snurps”) are RNA-protein complexes involved in splicing. Loss of Survival of Motor Neurons (SMN) protein due to loss-of-function mutations in SMN1 that cause spinal muscular atrophy result in failure to assemble snRNPs.
A “cleavage and polyadenylation” machinery is recruited after RNA pol II finishes the canonical end of an mRNA. This machinery cleaves off the remaining transcript that RNA pol II kept making, and brings in polyA polymerase to just add a bunch of As to the end.
Figure-by-figure
An antisense morpholino (AMO) against U1 snRNP protects it against RNase H.
On the surface of it, Fig 1C could be interpreted to mean that the control AMO is inducing splicing, because the does response only goes down to 2.5 μM, i.e. there is no control without an AMO. That’s an unlikely interpretation, but still it would have been nice to see this control.
The AMO from Figure 1 disrupts splicing activity, causing premature termination of transcripts.
This is similar to Figure 3. Some students in our class felt that instead of or in addition to showing 10 different specific genes in these two figures, it would have been nice to have some sort of meta-plot encompassing premature termination in all genes.
They use 3’RACE to identify polyadenylation sites in the prematurely terminated transcripts. The prematurely terminated mRNAs from Figs 2-3 turn out to get polyadenylated at cryptic polyadenylation sites (PASs).
They name the phenomenon they’ve observed so far “premature cleavage and polyadenylation” (PCPA). They now show that the PCPA problem that occurs upon U1 knockdown is not alleviated by mutating away splice sites. According to Fig 5A left panel, PCPA occurs far less if you knockdown U2, a different snRNP, or if you just generally inhibit the spliceosome with SSA. However, there is no loading control in Fig 5A to confirm equal amounts of RNA between bands.
Discussion
One student in our class criticized this paper for relying exclusively on HeLa cells. Confirming the findings in some sort of primary cultures or at a minimum some less aneuploid immortalized cells to show the phenomena here are not unique to HeLa would have been helpful.
Ingolia 2011: Ribosome profiling of mouse embryonic stem cells reveals the complexity and dynamics of mammalian proteomes
Historical context
The opening cites the papers announcing the first two drafts of the human genome [Lander 2001, Venter 2001] and the various new sequencing methods invented since then. They argue the next frontier is to be able to profile translation rates using sequencing.
Contribution
This paper introduces a method called “ribosome profiling” in which you arrest ribosomes, digest RNA that isn’t protected by them, then sequence the remaining ~30nt segments of RNA that were protected. This tells you the extent to which different mRNAs are being actively translated. They later published another paper specifically on this method [Ingolia 2012], which continues to be widely used today, although some of the specific biological conclusions of the 2011 paper have been challenged [Guttman 2013].
Figure-by-figure
They figured they needed to stop ribosome progression first. They compared two translation-inhibiting small molecules - cyclohexamide and emetine - and just a buffer expected to stop translation. The two small molecules cause a heavier pileup of ribosomes at start codons than the buffer does (Fig 1C), probably because they prevent elongation but not initiation, thus ribosomes still hop on to mRNAs even after the drug treatment. On the flip side, the buffer does not seem to totally halt elongation, because with buffer there ends up being a pileup of ribosomes at stop codons (Fig 1D). Also, emetine seems to favor protection of slightly longer mRNA fragments, though still on the order of 30nt (Fig 1B). Nonetheless, there is a very tight correlation between the number of reads per coding sequence in different methods (Fig 1A).
In Fig 2A, they quantify how skewed the distribution of read density over codons is. They ask “what percentage of codons in an mRNA (y axis) have at least blank times as many reads (y axis) as the median codon in that same mRNA?” For instance, tautologically, 50% of codons must have at least 1x as many reads as the median, so (1,50%) has to be a point on the teal line. Thus, the teal line (all ribosome-profiled reads) indicates that “100% of codons have at least 0 times as many reads as the median”, “10% of codoons have at least 5x as many reads as the median”, “0.02% have at least 50x” and so on. Their null distribution is given by random shearing of mRNA rather than using the ribosome profiling approach (green line labeled “mRNA”). By comparing teal to blue you can see that the distribution of reads is far more skewed in ribosome profiling than expected by chance, which indicates that ribosome pausing exists. By comparing purple to teal, you can see that stop codons have way more paused ribosomes than other codons do. In any event, they decide to draw a cutoff where a codon is considered to be a pause site if it has >25x the density of the median codon for its mRNA. This cutoff means 0.1% of codons will be considered pause sites. The rest of Fig 2 goes on to characterize thusly-defined pause sites.
One might expect that when a ribosome pauses, other ribosomes pile up behind it. If that were true, you’d expect that the read density around ribosome pause sites would be asymmetric, with a heavy left shoulder due to additional ribosomes piled up behind. That turns out not to be the case, at least on the average: Fig 2B shows that pause sites tend to have a single, sharp, symmetric, peak.
Pause sites are heavily enriched for D and E as the currently-being-translated codon, and P as the translated-two-codons-ago codon (Fig 1C). According to the same plotting method as Fig 1A, this motif is hugely enriched in ribosome-profiled reads (Fig 1D). From this paper, it is not clear why this should be the case. In Fig 1D you can see that a particular subset of four possible combinations of sequence at the nucleotide level (red line) is even more enriched than the >30 possible combinations of sequences that could encode the same few amino acids (yellow line). The authors don’t really dwell on this distinction. Our instructors speculated that this might be evidence that the pausing is not related to the amino acid, but rather associated with the RNA sequence itself - perhaps interaction with a Kozak sequence, analogous to the situation in E. coli ribosomes where pausing is caused by interactions between the rRNA and mRNA at any Shine-Dalgarno sequences.
Apparently there is a type of secretory pathway protein called “tail-anchored” which is different from any of Type I through Type IV and GPI-anchored. In “tail-anchored” (TA) proteins, the N terminus is in the cytosol and the C terminus is just stuck into the membrane, they are not “transmembrane” per se because nothing sticks out into the ER. Two such TA proteins were recently reported to have ribosome pausing at the stop codon, and this was purported to be a special feature allowing the insertion of the C terminus. This paper confirms that these transcripts do have pausing at the stop codons (Fig 2E) but also shows that there is just generally a lot of pausing at stop codons (Fig 2A) and that this is not particularly enriched in TA proteins.
They also confirm that there is an interesting pause site in the middle of Xbp1 which had been previously reported and seems to have an important functional role (Fig 2F). Xbp1 is a transcription factor that reacts to ER stress. The RNA is by default paused, until stress occurs, at which time the RNA is spliced in the cytosol and translation finishes, allowing the transcription factor to translocated to the nucleus where it activates the ER stress response [Calfon 2002, Yanagitani 2011].
In Figure 3 they use their new technique to measure the kinetics of translation. Harringtonine is a small molecule inhibitor of ribosomes which allows them to engage a potential initiation site but not to begin translation. Weirdly, it comes from these pine trees. These researchers apply harringtonine and then they wait 90, 120, or 150 seconds before adding cycloheximide to arrest translation elongation. Then they measure to what degree ribosomes are depleted in the early part of transcripts. This depletion is due to ribosomes having moved on (elongation) and not being replaced (by new ones doing initiation). They call this a “pulse-chase” strategy (note that no radiation is required though). They find that the average rate of elongation is 5.6 codons per second, and doesn’t vary much between any of the categories they stratified on - for instance, highly vs. lowly-expressed genes. They also don’t see slower elongation over rare codons.
It turns out harringtonine lets ribosomes bind to the mRNA at a start codon, but they can’t elongate past it. Thus when you treat with hartingtonine you get ribosomes piling up at start codons. In Figure 4 they take advantage of this to identify alternate translation start sites and alternate reading frames. The way they do this is complicated. Rather than just looking at places where reads pile up when you add harringtonine, they specifically look for a pileup with an asymmetrical distribution of reads left and right of it. They use a support vector machine (basically doing a discriminant analysis) trained on known translation start sites to figure out what this asymmetric profile looks like, then use the trained SVM to identify novel sites. They find that translation sometimes starts at a non-AUG codon, and that the non-AUG starts are enriched for “near cognates” (things that differ by 1 base from AUG), particularly CUG.
They next asked whether lincRNAs have ribosome footprints. They found very clear evidence that many lincRNAs do engage the ribosome, which is interesting, because others had previously thought lincRNAs were mostly nuclear, whereas if they engage ribosomes they must be cytosolic. It’s also interesting because what are the ribosomes doing on the lincRNA? The authors found that many lincRNAs contained a region on the order of 90 bp long that was as densely occupied by ribosomes as canonical protein-coding genes are. Based on this the authors speculated that maybe lincRNAs encode proteins, and even went so far as to dub them sprcRNAs. They didn’t present any orthogonal evidence for the presence of these proteins, nor for a codon-wise conservation pattern (first two bases in a codon are more highly conserved than the third) as seen in canonical protein-coding sequence.
Eric Lander later led an effort, which Ingolia and Weissman contributed to, that showed that lincRNAs are no more densely populated by ribosomes than 5’UTRs are, and concluded that lincRNAs do not in fact encode proteins [Guttman 2013].
This figure characterizes the upstream open reading frames (uORFs) that appear in their harringtonine experiments. They argue that these may play regulatory roles in some cases but may also actually be included in the translated protein sometimes.
I was interested in this because there is a body of literature, mostly about ATF4 (which they look at in Fig 6B), concerning the idea that mRNAs with uORFs have the unusual property that their translation rate actually increases when the unfolded protein response is activated and translation is globally inhibited [Morris & Geballe 2000, Harding 2000, Lu 2004, Calvo 2009] and there is a mechanism worked out for this, which involves translation starting from these uORFs [reviewed in Spriggs 2010]. It has been proposed that PRNP mRNA behaves in this manner, with translation rate increasing upon UPR activation and eIF2α phosphorylation [Moreno 2012]. There are indeed ribosomes bound to the 5’UTR of Prnp mRNA in the harringtonine-treated ES cells in this experiment - see epilogue below.
Some students in our class felt that they had not done enough validation to confirm that these ORFs really serve as initiation sites in vivo and that this is not just an artifact of harringtonine treatment - for instance, if harringtonine just makes ribosomes pause at possible start sites even though the ribosomes were otherwise just about to disengage rather than begin translation at those sites.
In this figure they look at how the profiles change as ES cells lose pluripotency and become embryoid bodies (EBs). There are tons of changes in translation, most of which are buried in a supplement. Fig 7A highlight one interesting subset which is that ribosomal proteins are still highly expressed in EBs at the mRNA level but are much less heavily translated in EBs than ES cells. The interpretation is that ES cells are stockpiling additional ribosomes, and by the time they become EBs they have enough ribosomes. In Fig 7B they show that there is a bit of a trend towards EBs having relatively less 5’UTR uORF translation than ES cells do, but this is not dissected any more finely. If you look at some of the uORF references [e.g. Spriggs 2010] there is a specific pattern of how regulatory uORFs work - the first one is constitutively translated, and then whether a second, out-of-frame one is translated is what determines whether the main ORF gets translated. So if you wanted to look for a signal of uORF regulation of main ORFs between EBs and ESs you would want to stratify by first vs. second uORF. You could also induce ER stress with tunicaymycin as a positive control for something that you strongly expect to cause a decrease in (second) uORF translation.
Epilogue
The data from this study are available on GEO in the mm9 reference genome. I checked out their harringtonine profiling data for my favorite gene, Prnp, for which I think they have used the annotation uc008mly.2, whose canonical start site should be at nucleotide 155. In bash:
wget ftp://ftp.ncbi.nlm.nih.gov/geo/series/GSE30nnn/GSE30839/suppl/GSE30839_GSM765295_ribo_mesc_harr150s-profiles.tar.gz
gunzip GSE30839_GSM765295_ribo_mesc_harr150s-profiles.tar.gz
tar -xvfGSE30839_GSM765295_ribo_mesc_harr150s-profiles.tar
cd fp_mesc_harr150s/
cat chr2\:131735655-131764173_45031_nt_counts.txt > ../prnp-mm9.txt
And then in R:
setwd('~/d/sci/061bbs230/week09/')
prnp = read.table('prnp-mm9.txt')
plot(1:length(prnp$V1),prnp$V1,type='h',axes=FALSE,xlab='location',ylab='read depth',main='Harringtonine-arrested ribosome profiling\nof Prnp in mouse ES cells',cex.main=.8)
axis(side=2,at=(0:3)*10,labels=(0:3)*10,lwd=0,lwd.ticks=1,las=1)
axis(side=1,at=c(155,155+765),labels=c('\ncanonical\nstart','\ncanonical\nstop'),lwd=1,lwd.ticks=1,cex.axis=.6)
which(prnp$V1==max(prnp$V1))
which(prnp$V1==max(prnp$V1[-139]))
I was impressed to find there actually is some decent data for Prnp - I had thought it was not very highly expressed in ES cells and might not even be detectable. Here’s what the profile looks like when ribosomes are arrested with harringtonine:
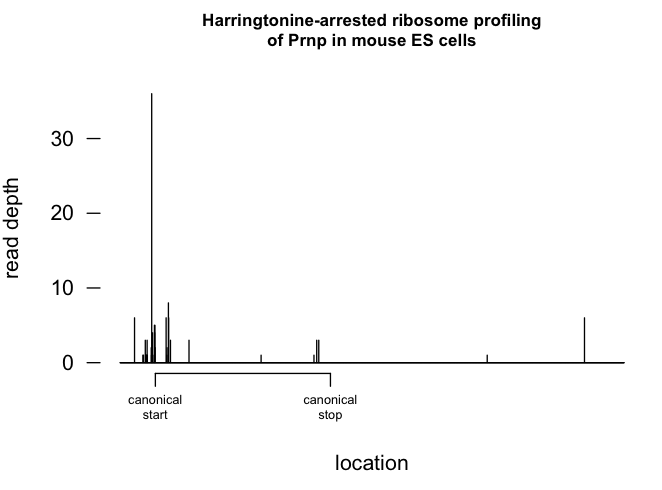
The main peak is at nt 139 (this may indicate they had a different transcript annotation than the one I had where the canonical start site is at 155). There is a smaller peak just to the right, at 212, about 24 codons downstream of 139, so right near the end of the signal peptide. I wonder if this represents ribosome pausing due to cotranslational translocation. There are also some much smaller peaks slightly to the left, but this may just be noise. Unlike human PRNP, mouse Prnp does not have the uORFs discussed in [Moreno 2012]. The putative alternate start codon of altPrP [Vanderperre 2011] is also not present in mouse Prnp.

About Eric Vallabh Minikel
Eric Vallabh Minikel is on a lifelong quest to prevent prion disease. He is a scientist based at the Broad Institute of MIT and Harvard.