How pharmaceutical industry financial modelers think about your rare disease

introduction
There exist about 1,500 FDA-approved drugs [Kinch 2014] and, to the best of my knowledge none in recent history has been developed without the involvement of a pharmaceutical company. Therefore, if you discover that you or someone you love has an incurable disease, and you decide you want to do something to change that, it is likely that at some point you will want to convince a pharmaceutical company to take interest in your disease. When you do, hopefully you will talk good science and tell a good personal story too, but at some point, the project may be evaluated by someone whose job it is to create financial models and figure out whether there is money in it or not.
Such is my situation. My wife and I found out seven years ago that she inherited a fatal genetic mutation that causes prion disease, and in response we both quit our old jobs, began re-training as scientists, and set out to find a drug for her disease. In the process we started the Prions@Broad initiative at the Broad Institute, we founded our non-profit Prion Alliance, and we started this blog. We also knocked on a lot of doors. Over the past seven years, we’ve met with tens of different companies to tell them about our disease, hear about their technology, and see if there was any way we could convince them to work on it. In most cases there wasn’t a clear enough nexus between our disease and their technology, but in a few cases things went far enough that someone started crunching numbers, modeling how and whether a drug for prion disease could be profitable. Over time we started asking what these models involved, figuring that understanding their thought process would give us a clearer idea of how this industry works, and what we as patient-scientists need to do to make our disease appealing.
After talking off the record with a number of people in the industry and reading a few publicly available sources — see for instance [Stewart 2001, Svennebring 2013], and this presentation, we have gotten a reasonable grasp. In this post, I’ll talk through my best understanding of how these financial models work, what assumptions are made, and what I think this explains about how the pharmaceutical industry works. Finally, I’ll share some thoughts on what these models imply that motivated patients can do to advance therapies for their own diseases.
how the models work
You learned in Economics 101 that profit equals revenue minus cost, so for drugs as for any other product, right there are two variables that matter. But for drugs, there are extra wrinkles. Compared to many products, drugs have two outsized complications: the revenues come long after the costs at best, and maybe they never come at all because the drug fails. In other words, lag time and probability of success are the other two major variables.
With those variables in mind, at a high level the models are simply net present value (NPV) or internal rate of return (IRR) models — they basically ask how, after adjusting for the probability of success and lag time, the potential longer-term revenues compare to the nearer-term costs. You arrange a spreadsheet with, say, one column for every year over a few decades, and one row per cost or revenue line item. At the top you input a large number of assumptions, which might be anything from wild guesses to reasonable benchmarks based on experiences with other drugs. One has to assume a discount rate, perhaps chosen based on some idea of what risk-adjusted rate of return you could make on your next best possible investment. One also has to assume what the drug development timeline looks like: what years you spend in which clinical trial phases and so on. And one makes number of different assumptions to drive an estimate of what the costs and potential revenues are. There are infinitely many details one can, and sometimes does, add to such a model — the rate of ramp-up in prescribing after drug approval, the time until market entry by generics after loss of exclusivity, corporate overhead and sales costs, and on and on. But at the level that I as a patient care about it, the take-home lessons from all this don’t depend much upon this extreme level of detail.
I couldn’t find a publicly available example of a financial model spreadsheet, so I tried my hand at creating my own simple NPV model in Google Sheets so that I could play with it and see how differing assumptions propagate through the system. You’re welcome to clone it and play with the spreadsheet yourself, and Greg Botwin has also created a Shiny web app that allows you to interactively tweak the assumptions and look at their consequences. In a moment I will talk through each of the assumptions and how they have shaped my thinking about what we can do to catalyze drug development in our disease. But first I want to take a high-level look at the model results and think about what they explain about how the pharmaceutical industry works.
To me, the biggest lesson from playing with this model has been to observe just how profoundly the lag time and probability of success shape the financial picture of drug development. Under the assumptions I have made, here’s a plot of the nominal — non-discounted and non-probability-adjusted — annual costs (red) and revenue (black) for this drug over the next 30 years:
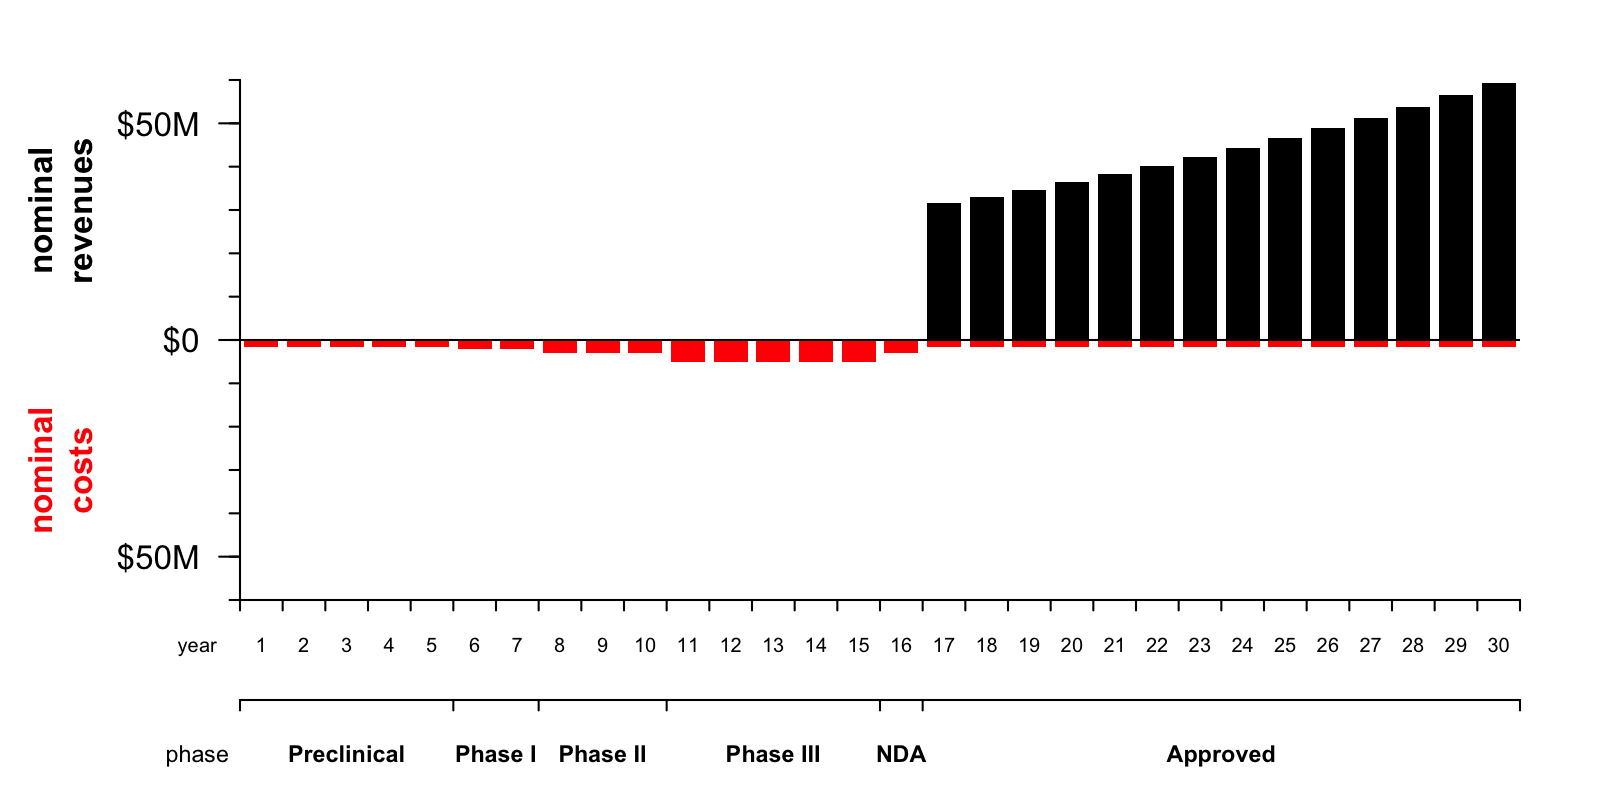
You can see at a glance that the total area of the black bars is greater than the total area of the red bars. This reflects the fact that, in nominal terms, the drug would be profitable — a company would stand to net $547 million by investing in this drug today.
The devil is in the discounting and in the risk. Here is a plot of how these factors impact the picture:
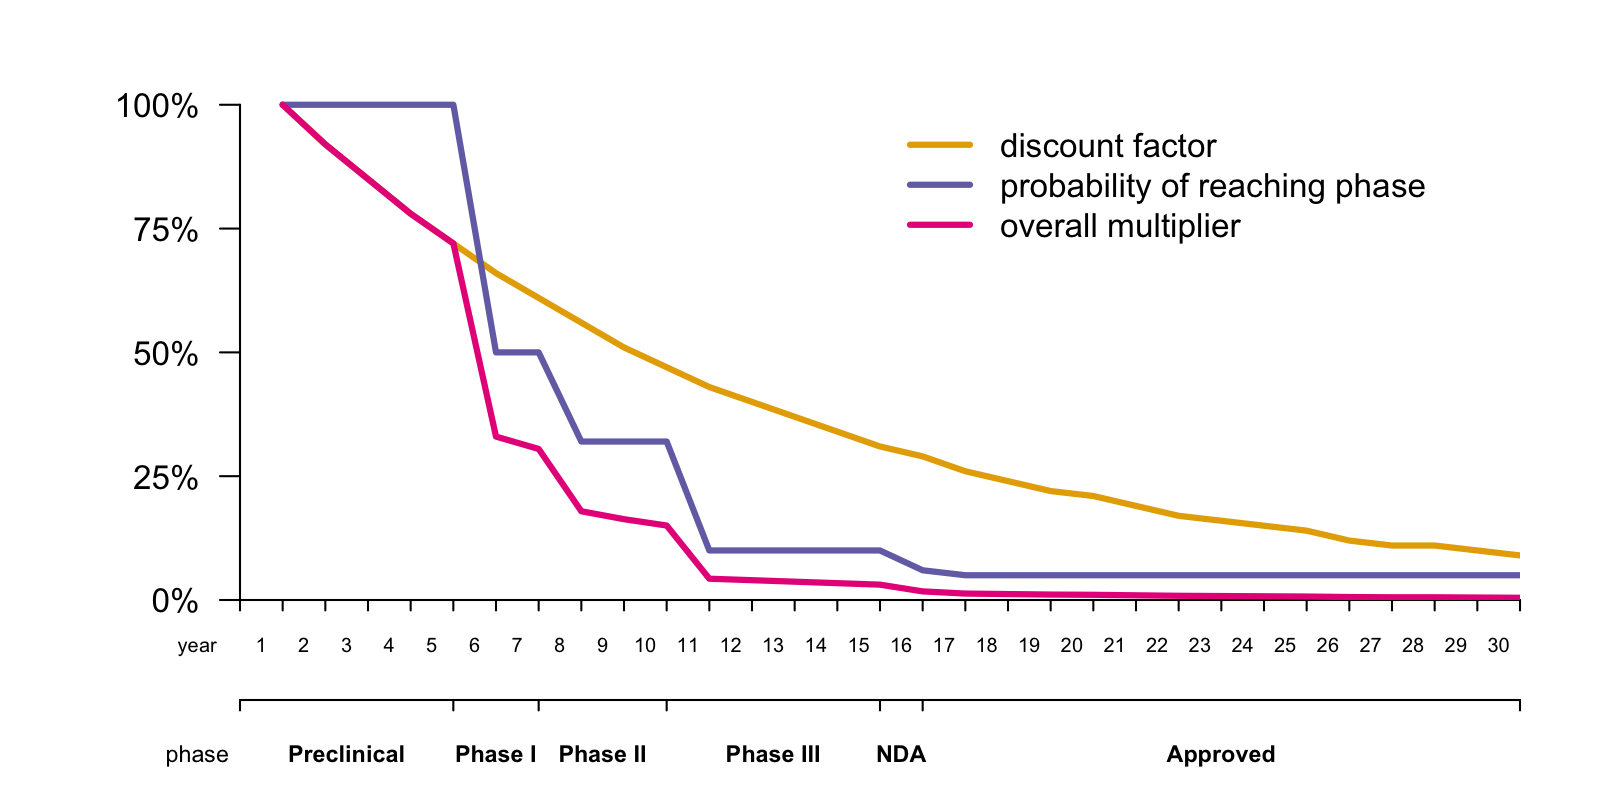
The yellow line is the discount factor, assuming a discount rate of 8% (this assumption is discussed further below). A dollar next year is worth 92¢ today, a dollar two years from now is worth 85¢, and so on.
The dark purple line is the probability of reaching each stage, based on an arbitrary assumption of 50% probability of advancing from preclinical to clinical, followed by the published clinical trial success rates for each phase as reported in [Hay 2014]. To give you a sense of the damage, it is estimated that only 10.4% [Hay 2014] to 11.83% [DiMasi 2016] of drugs entering a Phase I clinical trial ultimately result in an approved New Drug Application (NDA). That’s terrible news, mitigated only slightly by the fact that many things that fail, at least have the decency to fail early enough that their failure saves many would-be costs in addition to abolishing would-be revenues. Thus, the probability of reaching each stage of development applies to both costs and revenues in the model.
The devastatingly earthbound pink line is the product of these two factors — the discount factor times the probability of reaching each stage. This curve looks so terrible that I had to go back and double check my assumptions and make sure I hadn’t made an arithmetic error somewhere in my spreadsheet. But sadly, it’s true. The compounding of 8% discounting means that a dollar in year 17, the year in which this hypothetical drug is approved, is worth only 26¢ today. And the probability that my drug that is now in early preclinical development will actually result in in an approved NDA 17 years from now is only 5%. Multiplying these together, the net present value of a dollar’s revenue in the first year of drug approval is one cent today. Phrased differently, it takes a hundred dollars of drug revenue 17 years from now to motivate someone to invest one dollar today. No wonder drugs are expensive. If they weren’t, there wouldn’t be any new drugs. At least not unless a whole lot changed, and you can clone my Google Spreadsheet and play with it yourself to get a sense of just how much the assumptions would need to change to really alter that calculus.
Of course, some drugs are expected to be so cheap and quick to develop, so likely to succeed, so expensive, and/or so widely prescribed, that they actually can generate a hundred dollars seventeen years from now for every dollar invested today, and those are the drugs that we see in the world around us. But under the assumptions in my purely hypothetical Google Spreadsheet model, the effect of this one-cent-on-the-dollar reality is that a profitable drug becomes rather unprofitable. Here is the annual costs and revenues plot with the heights of the bars adjusted for the discount rate and probability of reaching each year of the development pipeline:
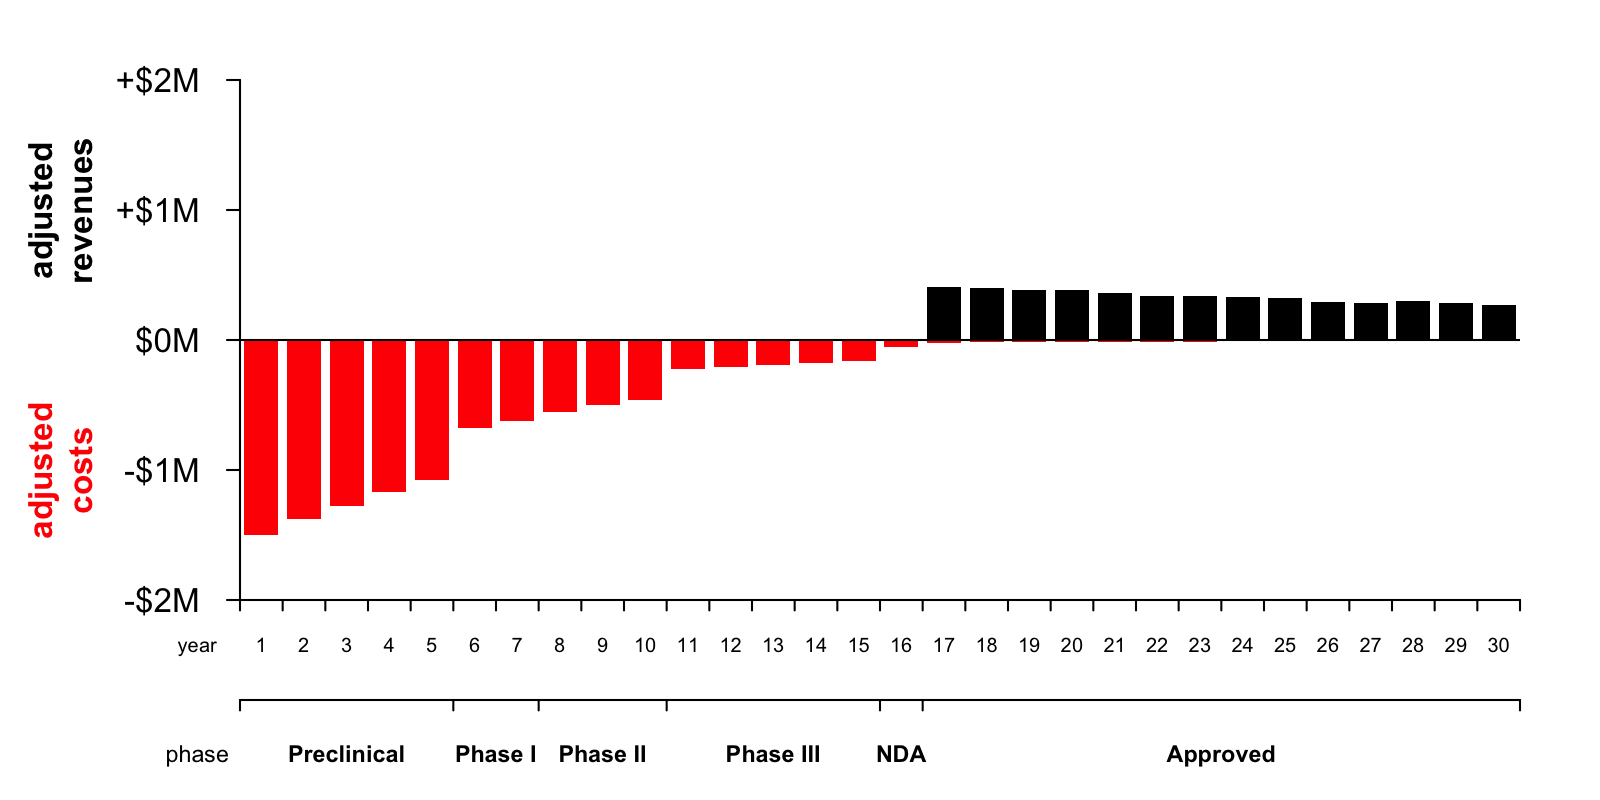
Now you can tell at a glance that the area of the red bars is much greater than the area of the black bars — with lag time and risk accounted for, developing the drug is now expected to result in a net loss of $6 million in today’s dollars. So this spreadsheet represents a drug that would not end up being developed.
What if that’s the drug for your disease? What can you do about this? In the rest of this post, I will try to understand the major factors that go into each of the four principal variables in the model — revenue, cost, lag time, and probability of success — because therein might lie a mandate for what patient organizations and patient-scientists need to do in order to transform an impossible disease into a “developable” one.
revenue
Revenue is the money a company is going to make by selling a drug. At a first pass, this is the price of the drug times the number of people that take it. A few key variables here are:
- Effective disease prevalence. At issue is not the incidence (rate at which new cases are diagnosed) nor the lifetime risk (proportion of people that ever develop the disease), but rather the point prevalence (number of patients at any given moment). In fact, it’s really the number of potentially treatable patients alive at any given time. This may therefore exclude patients who haven’t yet been diagnosed, and patients who are already too advanced. Thus, the long diagnostic odyssey we see in many diseases isn’t just frustrating for the patient and their family, it also means that de facto there are fewer treatable patients out there, and therefore, pharma companies will be less attracted to invest in the disease.
- Market share. Of the potentially treatable patients alive at any given time, how many will take the drug? Even if your drug is the first-ever drug for a previously untreatable disease, the market share is still not going to be 100%. Getting the drug to patients depends upon physician prescribing behavior and insurance company reimbursement. It also always has a run-up period as physicians and payors become aware of the drug — new drugs don’t reach high market share overnight.
- Price. The average annual price per patient. This often needs to take into account the patient compliance rate (how often do people actually fill their prescriptions). I would like to think that in rare, severe diseases the compliance rate is very high, making this a non-factor, but I haven’t seen any data and there may be exceptions.
What might patients be able to do to push these factors in the right direction? Raising awareness of your disease isn’t just feel-good stuff: if you can convince doctors to test for this disease sooner or more often, or convince patients to seek testing, or convince people at risk to sign up for a registry, you are increasing the effective disease prevalence (and without making the terrible disease itself more common). Anything you can do to improve diagnosis, whether it’s establishing referral networks, making testing available, establishing biobanks or datasets to help scientists validate diagnostic tests, could also help promote earlier and better diagnosis, thus boosting effective prevalence. Another issue is that, for many diseases, there simply aren’t good data out there on prevalence — cases are seen here and there and no one has undertaken a comprehensive epidemiological effort to figure out how many there are in total. Such a lack of information may make the financial modelers more inclined to be conservative (although to be fair, I’ve also heard some say that the prevalence once you have a drug usually turns out to be higher than what people thought it was when the disease was untreatable, because a drug motivates doctors and patients to pursue diagnosis). Any work you can do to figure out the prevalence of your disease — pulling together case series, estimating genetic prevalence based on public datasets, and so on — might help in establishing that the disease is prevalent enough to be “developable”. Finally, having a strong patient network and advocacy group is key: you want to make sure would-be drug developers understand that if and when a drug is approved, your patient organization will be on the ground making sure every last eligible patient gets the drug and takes it, and that their insurance companies pay for it.
cost
The costs include everything a company puts into developing, producing, testing, and selling a drug. The nature and amount of costs vary a lot by the phase of the project [Morgan 2011, DiMasi 2016]:
- Preclinical development costs. These are the costs of inventing the drug and bringing it to the point of being ready for human testing. Depending on the type of drug, this could start from screening small molecule libraries or raising and humanizing an antibody; regardless, it probably ends with Good Laboratory Practices toxicity studies to enable Phase I. I have sometimes heard the claim that preclinical costs pale in comparison to clinical-phase costs, but I have yet to see data to back this up. In the Tufts study of drug development costs [DiMasi 2016], pre-human costs were just under half as much as clinical costs in out-of-pocket terms. But because preclinical costs are incurred earlier, they inflate more when you apply a discount rate, and so the “capitalized” costs for preclinical development were actually almost as high as for clinical development. Rather than preclinical costs being negligible, I think the truth is just that they are very hard to estimate. Many people won’t even bother to do any modeling until they are ready to move to the clinical stage. In the spreadsheet I have used the simplistic approach of modeling preclinical costs based on a guess of how many staff with what salaries will be busy doing preclinical development for how many years.
- Clinical development costs. Models for clinical trials are basically cost per patient times number of patients, in each phase (I used $41,000 per patient per year from [Moore 2018]), plus some multiplier to account for salaries and other internal costs that the company must bear. Note that if your disease is rare, your trials are by necessity small, which — provided they’re still feasible and well-powered — is actually an advantage.
- Post-approval costs. Detailed models might include a lot of things that are both boring and that you have no control over, like the pharma company’s overhead rate, the cost of hiring a sales team to sell the drug, the costs of chemical synthesis or biological production, the distribution cold chain, and so on. There may also be royalty or IP costs. A common model is that the company (usually a major pharma) conducting clinical trials and eventually marketing the drug didn’t invent the drug — instead, they are partnered with, or licensing IP from, a biotech startup or an academic medical center that helped develop the drug. Therefore, from the pharma company’s perspective these partnership or licensing deals come through as a cost.
Of all these different costs, what can patients exert any influence over? The biggest potential area that I see is to push on clinical trial size and duration. From the patient perspective, you may be thinking you want large trials because you want every patient in your community to have the chance to enroll, but what you want even more is small, quick, efficient trials that result in the drug being approved swiftly so that then everyone can take it, and this latter goal dovetails with the need for trials to be small enough to be feasible even if your disease is rare, and affordable enough for a company to bother investing in developing the drug in the first place.
Clinical trials are usually designed to have a certain level of statistical power, and while power calculations themselves require myriad assumptions, a general rule is that you need more patients if the trial outcome takes longer to observe, or if underlying variability between patients is greater. Developing good, robust, measurable outcomes for your disease — whether clinical outcomes (things like FEV1 in cystic fibrosis, 6-minute walk test in muscular dystrophy) or biomarker outcomes — and identifying homogeneous patient populations (subsets of patients in which presentation and progression are similar) might do a lot to lower the clinical trial size. Both of these are goals you could pursue by organizing natural history studies that collect patients and observe the presentation and progression of disease under the current no-drug status quo. Such studies would be run by a clinical investigator at an academic medical center, but might rely heavily on patient groups to refer patients, raise funds, and provide input on study design and outcomes that patients care about.
A different instinct that we’ve certainly had, and that I’ve heard from other activated patients as well, is that one can make a drug development program more appealing by coming with a therapeutic lead in hand and thus shaving off time and costs from the preclinical development stage. Whether this idea holds water will inevitably depend upon the specifics of your disease biology and proposed therapeutic modality, so I don’t know that there is any generalizable rule, but I will share a few things I’ve come to realize. One is that if you launch an academic or biotech effort to find a lead, you have to consider your own discount rate and probability of success — what else could you have done with those dollars and years — and your odds may not turn out to be better than an established company investing in this space, particularly if the latter could leverage an existing discovery pipeline and in-house expertise rather than starting from scratch. Then there’s the question of if you fail and end up with no lead, what will you learn? Sometimes the answer is a lot, sometimes it’s nothing — it all depends on the disease specifics — but I’ll at least flag that there often exists a risk of types of failures that one cannot learn much from, whereas the benefits from natural history studies and other areas you can invest in (see above and below) might be more predictable. Finally, depending on the terms (be they dictated by venture capital or by university IP licensing rules) under which your preclinical discovery work is done, even if you do find a promising lead it may not appear to potential pharma partners as a free lunch — in some cases the laws of economics may dictate that it costs them as much, or a significant fraction as much, to license the IP as it would have cost to develop it.
lag time
The key variable in lag time is the time from when the first dollar is spent until the drug is approved. The reality is just slightly more complicated, of course. There are multiple regions with different regulatory agencies, so approval is not a monolith. How lag time is distributed within different stages of the development pipeline also matters a bit, since discounting affects costs as well as revenues. And another temporal factor is the duration of market exclusivity after approval. But all of these are details — the key question is when will the drug be approved, and how much is a dollar in that year worth today?
It’s worth taking a brief aside to talk about discount rates. Why is the discount rate in my model 8% even though I’m certainly not earning 8% on my personal savings account and inflation is nowhere near 8% right now? Discount rates are determined by the expected yield from whatever someone — and imagine here a very financially sophisticated someone — could do with the money if not investing it in this drug. Maybe they’d invest it in a different drug, or in startups in a different sector, or in real estate, the details don’t matter, but to the people who possess the staggering amounts of money required to make a drug, there are many potential investment routes that would yield an 8% annual return. Indeed, if anything I think most finance folks and economists would object that my discount rate is too low. 8% is a figure I often saw used in public policy circles (my Master’s degrees are in city planning and transportation engineering) for evaluating public-sector investments in infrastructure.
There’s not much one can do to change discount rate, so what can one do to change the lag time? Here, again, my take is that the key thing to push on is clinical trial duration. Particularly in rare diseases, there can be opportunities to compress or combine trial phases. Scientifically, what is required might be good biomarkers and/or good clinical outcome measurements, and finding those might require natural history studies, biobanks, and registries, all things that patient groups can help to catalyze by funding, advising, and/or getting multiple investigators to collaborate with each other. Figuring out how to actually leverage those tools to expedite trials might involve a conversation with regulators, and there are increasingly many opportunities for patients to have these sorts of conversations with FDA, distinct from the types of meetings available to pharmaceutical companies as drug sponsors.
probability of success
The biggest hit that the model takes, even bigger than discounting, is the risk, or rather, likelihood, that the drug fails. In industry parlance, the variable in question here is “probability of technical and regulatory success” (PTRS). As noted above, published data show that in the aggregate, PTRS from the time a drug enters Phase I is only about ten percent [Hay 2014, DiMasi 2016]. This is broken down by success rates at each phase, because early failures (when you haven’t yet spent on a Phase III trial) are less costly than late stage failures. Absent any data to make a more informed assumption, these sorts of aggregate statistics are a good starting point for a model, and I’ve used the phase-wise probabilities from [Hay 2014] in my spreadsheet. But the probabilities can differ a lot depending on indication (apparently infectious disease has the best success rate and oncology the poorest), modality (monoclonal antibodies fare better than small molecules), and many other factors [Hay 2014]. For any one program, given the specifics of the drug, the disease biology, the patient population and so on, modelers may well feel inclined to assume that the probability of success is higher or lower than the average. What can you do to convince them (and moreover, to be right in convincing them) that the probability is higher than average for your disease?
Here, the magic word I have heard over and over again from people in the industry is de-risk. You may not be able to do much about drugs that fail on safety — that’s really the company’s job — but many drug candidates fail on efficacy, and this is where both the fundamental science of your disease, and the tools used to study it, really matter a lot.
The first mandate is to be dead certain about the therapeutic hypothesis. What causes the disease? What is the molecular target and the mechanism of action that you want a potential drug to have? What benefit do you expect that mechanism of action to yield — in what group of patients at what disease stage after what duration of treatment? These are the fundamentals without which drug development is a shot in the dark. And crazily enough, sometimes drug companies do take shots in the dark — but usually only for very common indications (think Alzheimer’s disease) where the potential upside is so astronomical as to outweigh a probability of success that is yet much lower than the already-low average of 10%. The rarer your disease is, the less you can afford the risk that the therapeutic hypothesis isn’t even right in the first place. For many diseases, the therapeutic hypothesis is already clear — I am grateful every day that Sonia and I were born late enough to completely miss the debate over whether prion disease was caused by a virus, and to have come to our mission knowing with certainty that it is caused by prion protein. But in a disease where the therapeutic hypothesis is not yet clear, that is the paramount area to invest in. And whereas therapeutic lead molecules may come and go, disease mechanism is forever.
The second mandate is to develop tools for drug development. This is likely to include registries and good referral networks and so on, to make sure you can find the patients when you need them and you don’t fail for lack of enrollment. It is also likely to include (again) clinical tools like biomarkers and clinical outcome assessments and natural history datasets. These can help you make sure a trial is well-designed and adequately statistically powered. Consider for example the power of a pharmacodynamic biomarker (concept introduced here), which can read out whether a drug is having the molecular effect that you expect. While such a marker does not directly tell you whether the drug is affecting the disease state, it at least tells you if the drug it hitting its target (target engagement) and can help you find the right dose. Similarly, a good clinical outcome measure might allow you to at least get a whiff of efficacy (or lack thereof), from early small trials to help make go/no-go decisions before reaching costly large trials. Without these sorts of tools, you’re flying blind all the way into the most expensive trial stages. A situation that is likely to scare drug companies off is when the only way to have any idea whether the drug is doing anything in people is to wait all the way until the end of a large, long Phase III. Depending on the disease, this “developing tools” mandate might also include whatever preclinical tools might be likely to be predictive of clinical success. In some diseases, that might be patient cell lines, in others it may be mouse models, in others you don’t know yet what preclinical tools will turn out to be useful, but you probably still want some.
conclusions
Not everyone wants to become a scientist at the bench like we did, but a lot of motivated patients contribute in a lot of different ways to advancing therapeutics for their own diseases — whether through advocacy, organizing the patient community, organizing the researcher community, fundraising and betting on different investigators and scientific approaches, or myriad other ways. A lot of these are things we work on too in addition to our science at the bench. In the seven years we’ve been at it, we’ve come to see more of the big picture of what makes a disease “developable”. From my initial attitude of “we have to find a drug” we’ve shifted more towards thinking “we have to enable a drug”. A lot of drug companies and biotechs have profound expertise in finding a drug, expertise that we would be hard-pressed to match in our academic lab, whereas they are not experts in our disease. Our interactions with industry and understanding what they look for have shaped what we think are the priorities for us to accomplish, and I now see that a lot of that is reflected in the financial model here.
One way I’ve started to think about it is by an analogy to pistachios — see the photo at the top of this post. What I’m about to say does not apply to really truly ultra-rare conditions, where exceptionally creative “N of 1” approaches may be required, but I think it applies to diseases as rare as prion disease and probably even a bit rarer. Even in pretty rare diseases, from a pharma company’s perspective, a drug can always be priced for more than it costs to manufacture and distribute, so every potential drug would be profitable, if only success were certain and instantaneous. The jeopardy lies in whether the revenues are so much larger than the costs as to offset the years and years of lag time and overwhelming likelihood of failure. Every pistachio has a delicious nut at its center, the question is whether that nut is bursting out of the shell or barely visible through the tiniest seam. One way to think about our job as activated patients is that we need to pry our disease open, and make it an easy nut to pluck.
To give just one final example of how my interactons with industry have shaped my thinking, the other day I was speaking with someone at a startup that had a very specific technology applicable to just one specific class of genes. They had founded a company based on this new technology, and only later circled back to figuring out exactly which target(s) within this class they wanted to go after. I asked what the thought process had been for deciding on a target. They said they pulled a list of all the genes their technology could target, then intersected it with a list of disease genes. They then spent a few days Googling each gene on the intersected list and taking notes. The criteria? They asked which genes had a rock-solid biological link between the gene and a severe disease, along with a well-organized patient community and registry. As a bonus, it helped if the disease also had at least some progress on assembling clinical cohorts, documenting natural history, and characterizing biomarkers. Those criteria were enough to narrow the field down to three genes, all of which the company was pursuing.
I think of that conversation not infrequently, thinking to myself, who knows what other technologies are out there, what other patents haven’t been published yet, what other startups are still in stealth mode, who is out there Googling a list of ten or a hundred genes to figure out which is “developable”. When they Google PRNP, my job is to make sure they say, now this is a gene we can go after.
There are a lot of caveats to everything in this post. Every disease is different in its biology, its clinical picture, and how much is already known or has already been accomplished by researchers in the field. Prion disease is really my focus, and there will certainly be unconscious assumptions that I’ve made here that won’t always apply elsewhere. I’m not an expert in anyone else’s disease, but I wrote this post in the hope that, once you get done ignoring everything here that just doesn’t apply, there still might be lessons left that are generalizably useful.

About Eric Vallabh Minikel
Eric Vallabh Minikel is on a lifelong quest to prevent prion disease. He is a scientist based at the Broad Institute of MIT and Harvard.