Tissue-specific gene expression data based on Human BodyMap 2.0
motivation
Often I find myself needing a quick reference on how highly expressed a particular gene is across different tissues, either to browse visually or to combine with other data in an analysis. There are a few resources for this online:
- TiGER [Liu 2008] has gene expression levels across 30 human tissues based on NCBI EST data, which can be browsed visually or downloaded, but the method by which the data were created has never been clear to me even after reading the paper, and the documentation is sparse.
- GeneCards.org has protein expression levels in a little graphic for each gene across several tissues (e.g. PRNP) based on MOPED and PaxDB data, but they aren’t downloadable.
- BioGPS has microarray gene expression data for 79 human and 61 mouse tissues, including several cancers, which can be browsed visually or downloaded.
- The Allen Institute Human Brain Map has microarray for hundreds of human brain regions, along with several tools for browsing visually, comparing regions, and downloading subsets of data.
- GTEx has RNA-seq expression levels for about 40 postmortem human tissues from hundreds of donors (and counting). Sadly, most of the data is under lock and key at dbGaP, and as of today only the called eQTLs have been made public. They recently added a “Search genes…” feature where you can type in a gene symbol such as PRNP and view a pretty graphic of average gene expression across tissues (grouped across all samples), but so far there is no option to download the underlying expression values.
These are some pretty cool tools, but they don’t always meet my needs. For instance, I analyze RNA-seq data, so it’s nice to have RNA-seq data to compare to. Sure, RNA-seq protocols and computational pipelines can differ a lot between one another, but at least it’s better than comparing RNA-seq to microarray. I also like to have something I can download to merge with other datasets rather than picking out individual genes or looking at a graphic.
I was excited, therefore, when I found out about Human BodyMap 2.0, a fully public RNA-seq dataset across 16 human tissues brought to us by Ensembl and Illumina. It doesn’t divide the brain into regions, but other than that, it’s a pretty awesome dataset. Ensembl has provided aligned BAMs (a huge convenience) but no gene expression results. So I set out to call gene expression levels from the BAMs for my own future use, and figured I might as well put the results online while I’m at it.
methods & caveats
I downloaded the Ensembl BAMs, then used Cufflinks to call fragments per kilobase of exon per million reads (FPKMs), a measure of gene expression normalized to gene size and RNA-seq library size, and then used several Unix command line tools and R to combine and reshape the data. Here is the full bash script I used.
A few notes and caveats:
- I only called known transcripts using the Ensembl GRCh37 gtf file and did not ask Cufflinks to discover novel transcripts.
- Since I used Ensembl’s gtf file I ended up with ENST transcript IDs instead of RefSeq transcript IDs. I couldn’t find a really good simple tool for mapping between these ID sets, so I didn’t bother and am only using the gene symbol results.
- For genes with more than one Ensembl
gene_idmapping to the samegene_short_name(i.e. gene symbol), I took the sum the FPKMs for the multiplegene_idvalues. - I discovered that Cufflinks throws a
Segmentation fault (core dumped)instantly upon trying to open any of the Human BodyMap BAMs, a phenotype which was rescued by deleting the@RGlines from the BAMs. Not sure why that worked. Cufflinks could handle one@RGline but not the other, despite that viewing the raw characters in the single offending line withod -cdidn’t reveal anything untoward. - I didn’t run Cuffcompare or Cuffdiff to test whether differences in expression between tissues were significant, and didn’t limit results to transcripts with some minimum number of FPKMs. In other words the data are pretty raw.
results
Here is a 6 MB csv file of expression by gene symbol (52686 rows) and tissue (16 columns). You can open it with Excel, but be warned, Excel will autoformat the gene symbols, corrupting any of them that look like they could be numbers or dates. I prefer to work with it in R. Here’s a trivial bit of R code to get you started opening up the file and plotting the FPKMs for one gene:
gene.df = read.table('gene.matrix.csv',sep=',',header=TRUE,stringsAsFactors=FALSE) # load table
gene.matrix = as.matrix(gene.df[,2:17]) # cast the FPKM columns to a matrix
rownames(gene.matrix) = gene.df$X # reassign the gene symbols as the row names for the matrix
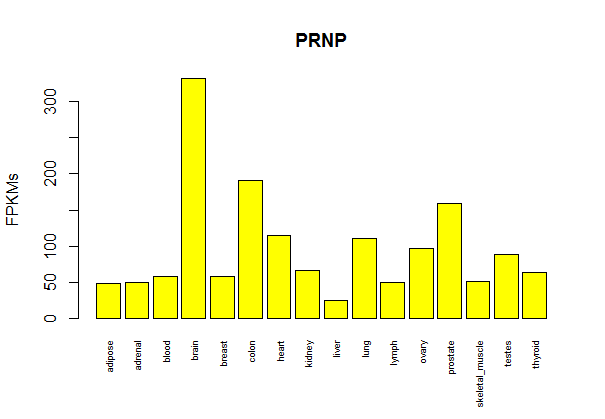
barplot(gene.matrix['PRNP',],cex.names=.6,ylab='FPKMs',main='PRNP',col='yellow',las=3) # cex.names shrinks tissue labels, las=3 makes them perpendicular
Result:

About Eric Vallabh Minikel
Eric Vallabh Minikel is on a lifelong quest to prevent prion disease. He is a scientist based at the Broad Institute of MIT and Harvard.