Introduction to conformation-dependent immunoassay
background
PrP was first discovered and purified using a protocol that included proteinase K digestion and yielded a 27-30 kDa protein fragment dubbed PrP 27-30, which was found in the brains only of infected animals [Prusiner 1983]. But soon it became clear that PrP was not a strictly foreign pathogen but in fact a host-encoded protein, a gene present in the genome of infected and uninfected animals [Chesebro 1985, Oesch 1985]. However the PrP in infected animals appeared to differ from that in uninfected animals by some post-translational event. PrPSc therefore came to be operationally defined by two biochemical properties that PrPC lacked: protease resistance and detergent insolubility.
That paradigm stood pretty solid for over a decade. By the late 1990s, PrP’s identity as the “scrapie agent” was pretty well-accepted – like, Nobel Prize well-accepted. Still, occasionally results came up that didn’t fit with the paradigm of infectivity being inseparable from PrP-res – for instance, BSE on first passage in mice was found to cause disease without any PrP-res at all [Lasmezas 1997], and a few skeptics continued to question whether PrP was really the disease agent. But the world would soon learn that the cracks beginning to show weren’t cracks in the prion hypothesis, just in the particular operational definition of PrPSc in use at the time.
Luckily by this time a third property of PrPSc had attracted notice. Besides its PK resistance and detergent insolubility, its abnormal conformation also buried several epitopes that are normally exposed on the surface of the protein in PrPC. This meant that some antibodies, including 3F4, were in practice specific to PrPC and would not bind to PrPSc [Serban 1990].
The conformation-dependent immunoassay or CDI [Safar 1998] turned this conformational property into an assay. In developing this assay, Safar accomplished several things. He clearly demonstrated the existence of proteinase K-sensitive PrPSc, and created a tool for measuring it. He also created a tool for quantifying certain dimensions of conformational diversity among prion strains.
Here’s how it works. Guanidium hydrochloride (GdnHCl) denatures proteins – including even PrPSc at high enough concentrations. Denature here means causing the proteins to unfold, to lose their secondary, tertiary and quaternary structure – the proteins maintain primary structure and are not degraded. Safar found that if you treat PrPSc with GdnHCl, 3F4 (and other antibodies) will bind once again, just as they do to PrPC. So: measure the binding of 3F4 before GdnHCl treatment (PrP in its “native state” or N) and after GdnHCl treatment (“denatured state” or D). In principle, the “N” quantity is PrPC and “D” is total PrP, so D – N = PrPSc, including both PK-resistant and PK-sensitive fractions. He refers to these as rPrPSc and sPrPSc respectively.
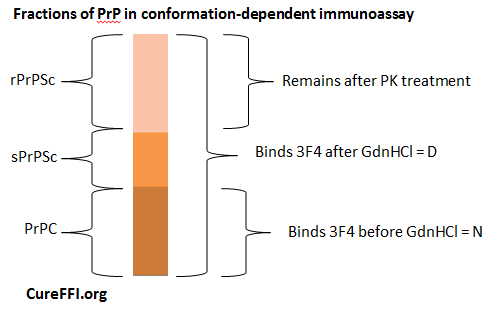
The principle of it is that simple. In reality, this diagram is a great oversimplification. For one, even PrPC actually has slightly increased affinity for 3F4 after denaturation with a small (1M) concentration of GdnHCl [Safar 1998 Fig 2a], though it returns to its native affinity level at even higher concentrations [Safar 1998 Fig 4a, “C” control curve]. For another, in practice this assay is conducted in an ELISA format with fluorescence as a readout, which means that the ability to detect antibody binding at all, and especially to detect a difference in binding in denatured vs. native protein, depends on the total concentration of PrP, level of background from other proteins, etc. Much of the paper is devoted to establishing the sensitivity and dynamic range of the assay.
But amidst these annoying real-life implementation complexities, CDI also has another complexity that makes it extra useful. Above I’ve just said “GdnHCl treatment”, but I didn’t say how much GdnHCl. It turns out that by the time you get up to 6.5 M (quite a high concentration indeed), pretty much 100% of PrPSc is denatured, in every strain where this has been tested. So if you just wanted a way to quantify total PrPSc, then D – N at 6.5M GdnHCl is your number. On the other hand, the fact that GdnHCl causes only incomplete denaturation at lower concentrations is informative about strain properties. Fig 4 presents curves for how the D/N ratio changes for three different hamster prion strains at different GdnHCl concentrations – each strain is unique, indicating a different degree of susceptibility to denaturation, a property prion researchers often refer to as “conformational stability.” To sum up such a curve in just one number, many people refer to the [GdnHCl]½ value of a given strain, which is the concentration of GdnHCl at which the strain is half denatured, i.e. has half the D/N ratio that it has at 6.5M GdnHCl.
CDI also offers other ways of typing strains. Since it is capable of measuring total PrPSc, it allows one to quantify the concentration (μg/mL) of PrPSc in brain samples taken at the time of terminal illness. This concentration, too, turns out to vary by strain. Finally, because CDI can be combined with PK digestion, it is possible to determine the fraction of PrPSc that is PK-resistant, a property which, again, differs by strain.
Used directly on unpurified brain homogenate, CDI is great for strain typing but not amazing at detecting small amounts of PrPSc. Safar offered an improvement on the assay’s sensitivity by also showing that sodium phosphotungstate (NaPTA) precipitates PrPSc (regardless of PK resistance) from brain homogenate, making it possible to run CDI on a purer sample and detect as few as 103 infectious doses (ID50s). Later authors have created other variations on CDI that offer yet more sensitivity [Bellon 2003 (ft)].
CDI is sufficiently labor-intensive that plenty of researchers don’t bother with it. At the same time, it doesn’t seem an overstatement to say that CDI revolutionized the way we define PrPSc. Other protocols have since been developed for purifying particular fractions of PK-sensitive PrPSc [Pastrana 2006] but no other method offers the ability to quantify the entirety of PK-sensitive PrP.
This quantification has led to some surprises. Of the eight hamster prion strains that Safar typed in his original paper, PrPSc turned out to comprise about 75 – 90% of total PrP in the brain at the time of terminal illness. (This is phrased as a 3-10 fold excess of PrPSc over PrPC). The total concentration of PrPSc also differed from about 10 to 40 μg/mL. The proportion of PrPSc that was PK resistant also varied widely – percentages are never given, but can be eyeballed from Fig 3b-c, for instance, DY has about 12 μg/mL PrPSc and only < 1 μg/mL rPrPSc, meaning probably < 8% is PK-resistant. ME7 is more like 40 vs. 8 μg/mL, so ~20% PK-resistant. HY is about 26 vs. 18, so ~70% PK-resistant.
A few years later, Safar applied this assay to typing human sCJD cases, with equally surprising results [Safar 2005]. PrPSc in sCJD turns out to be at minimum 80% PK-sensitive, and on average more like 90%. (He combines data for 8 patients with different 129 genotypes and Type 1 vs. 2). CDI also detected PrPSc in every single brain region in every single patient – even in regions where MRI and histological examination did not turn up anything. This placed CDI in the running as a possible diagnostic tool, though that has never really come to be, and instead RT-QuIC now looks poised to become the first biochemical PrPSc diagnostic test [Atarashi 2011 (ft) and see overview by Caughey 2012].
Safar’s CDI data have also served as a basis for a good deal of hypothesizing about some of the fundamental mysteries of prion disease. In Fig 3d, Safar plots strain incubation time (y axis) vs. the concentration of PK-sensitive PrPSc found in the brain at terminal illness (x axis). He finds a linear correlation, and argues that this represents something fundamental about prion pathogenesis:
the different incubation times of various prion strains should arise mostly from distinct rates of PrPSc clearance rather than from different rates of PrPSc formation24. Prion strains that are readily cleared, therefore, should have prolonged incubation times, whereas those that are poorly cleared should have abbreviated incubation periods. We investigated this by relying upon the difference in brain PrPSc concentrations before and after proteinase K treatment as a surrogate for in vivo clearance of each prion strain. When clearance, as approximated by [PrPSc]–[PrP 27-30], was plotted as a function of the incubation time for eight strains, a linear relationship was found
I find myself unable to agree with this interpretation. I don’t have the raw data but it sure looks like the linear correlation in Fig 3d is almost entirely driven by ME7, which is an outlier on both dimensions, with a 300+ day incubation time and a huge concentration of sPrPSc. I also notice that the error bars on many of the dots (strains) are large enough to overlap. To me, it’s not clear there’s even a real correlation here.
Supposing there was a correlation, though, I don’t see the basis for equating PK-sensitive PrPSc concentration with “clearance”. If PK-sensitive ME7 prions are so easy to clear, then why are there so many of them by the time of terminal illness? Far from representing clearance, the level of sPrPSc would seem to reflect the cell’s inability to clear it. PrPSc, whether sensitive or resistant, seems to accumulate over the course of prion disease -certainly the data in Fig 3a support that, as does Safar’s later work [Safar 2005b (ft)].
Here’s one alternate interpretation of the correlation: PrPSc accumulates over time in any prion strain, with fairly similar rates but quite different degrees of toxicity, so that in some strains (ME7) a large amount must accumulate over a long time in order to cause terminal disease, while in other strains (HY) it takes only a small amount of PrPSc to kill neurons, and so incubation times are short.
This gets into the question of PrPL – is there a specific lethal species of PrP? – which I’ll address in detail in a forthcoming post. Based on Safar’s CDI data on the concentrations of PrPSc in Fig 3a, though, it seems hard to deny that different amounts of PrPSc are present at death in different strains. The right interpretation isn’t clear, but at least it is probably not sufficient to suppose that all PrPSc is equally toxic.
A more recent paper by Safar’s group seems to abandon the earlier interpretation of the CDI data, no longer arguing for a correlation between sPrPSc levels and incubation time. Instead, a connection is drawn between incubation time and the conformational stability of sPrPSc oligomers as measured by CDI [Kim 2011, Kim 2012].

About Eric Vallabh Minikel
Eric Vallabh Minikel is on a lifelong quest to prevent prion disease. He is a scientist based at the Broad Institute of MIT and Harvard.