Genetics 11: 'Transposon sequencing (Tn-seq): how to identify mutants that die'
These are my notes from lecture 11 of Harvard’s Genetics 201 course, delivered by Tom Bernhardt on October 1, 2014.
Last time we discussed a study of gene regulation using reporter genes and transpoosons. Suppose that you have transposon-mutagenized your bacteria and have found a mutant in which expression of the reporter gene (LacZ in our example) is constitutive, making the colony blue. What do you do next?
- Pick the colony and streak it on a new plate to confirm that it remains blue. If the answer is yes, advance to #2.
- Test linkage of the blue phenotype to the transposon, by P1 phage transduction. This involves preparing P1 phage lysate of the mutant strain (the “donor” strain), infecting the parental/original non-mutant reporter strain (“recipient” strain) with the phage lysate, and testing the phenotype of the transductants. (Recall that your transposon contains an antibiotic resistance gene which allows you to perform selection). If they are blue, you’ve shown linkage. The interpretation if they are white is left as an exercise. If they are blue, advance to #3.
- Map the transposon insertion site. There are several methods for this - see below.
Methods for mapping transposon insertion sites
Arbitrarily primed PCR
One method is arbitrarily primed PCR. In this method, you perform PCR with a forward primer (Primer 1) matching the transposon sequence, and a reverse primer (Primer 2) with a randomized element fused to a recognizable tag. To be clear, the reverse primer contains N base pairs of random DNA (i.e. you get one tube which contains molecules with billions of different sequences), with a specific tag hanging off the end which you can recognize later but which does not need to match any particular bacterial sequence. You then perform one round of PCR with Primer 1 and Primer 2, and you’ll get a small amount of product, corresponding to only the tiny minority of Primer 2 sequences that match something near your transposon. You then have Primer 4, a forward primer matching a transposon sequence downstream of Primer 1, and Primer 3, a reverse primer matching the specific sequence of Primer 2. These two specific primers let you amplify an abundance of PCR product, which you can then Sanger sequence to determine which random part of Primer 2 matched something near your transposon.
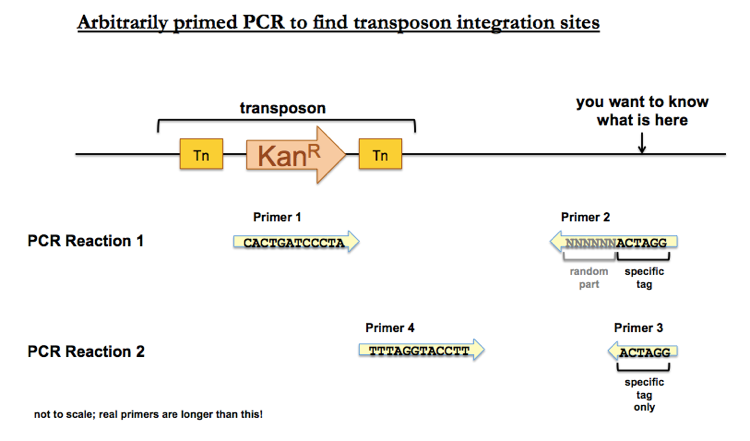
The best way to reassure yourself that your product truly represents unique sequence near the transposon and is not just random errors is to do the same PCR reactions on the parental strain (which does not contain the transposon) and show that you don’t get that same product in the parental strain.
Once you’ve found the sequence into which the transposon integrated, you can then look up this sequence in the reference genome for your parental strain to see where it is. If it is in an uncharacterized gene, your next steps might be to BLAST it to look for homologous genes in other organisms that are characterized and might give you a hint to its function, or to predict its domains as another inroad to guessing the function. You also could knock it out and test the knockout phenotype, and/or test complementation by putting the gene into a plasmid.
Replica plating
Suppose you want to know how a particular strain of Pseudomonas aeruginosa, a pathogenic gram-negative bacterium, acquired ampicillin resistance — in other words, you want to identify the AmpR gene. You can transposon mutagenize the resistant strain, but then the phenotype you are looking for is ampicillin sensitivity, which means you’re interested in the mutants that die.
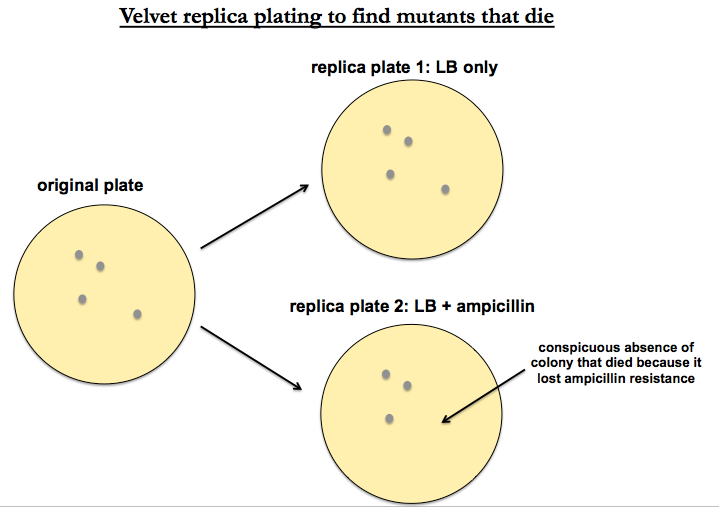
To find mutants that die, you want a classic technique called replica plating. Take your library of transposon-mutagenized Pseudomonas, and plate them on plain LB with no antibiotic. Then “replicate to velvet” - i.e. press a tautly stretched piece of velvet to the surface of the plate, then dip it onto the top of (1) a fresh plate with LB and (2) a fresh plate with LB + ampicillin. In this way you are essentially “stamping” the original colonies onto new plates. Plate #1 is a positive control which should replicate exactly the physical positions of colonies from your original plate. Plate #2 should replicate the same positions except for the mutants that die. Once you’ve identified conspicuous absences on your plate #2 representing colonies that died, you can go back to plate #1 to get a copy of them that you can sequence.
This method is fairly low throughput. The high-throughput analogue is known as Tn-seq.
Tn-seq
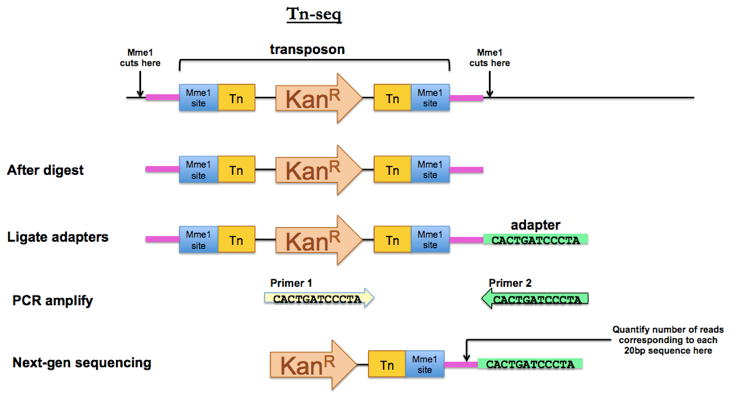
To do Tn-seq, when you prepare your transposon, your inverted repeats flanking the resistance gene need to contain Mme1 restriction sites. The Mme1 restriction enzyme has the agreeable property that it cuts 20bp away from the recognition site. This allows you to digest the genomic DNA of your tranposon-mutagenized library with Mme1, thus isolating fragments that contain the entire transposon plus 20 bp of unique genomic sequence on either side of the integration site. Ligate adapters and PCR amplify using a forward primer unique to your transposon and a reverse primer unique to your adapter. Then submit the PCR product for next-gen sequencing. That 20 bp segment of genomic DNA adjacent to your Mme1 site will tell you where the transposon integrated.
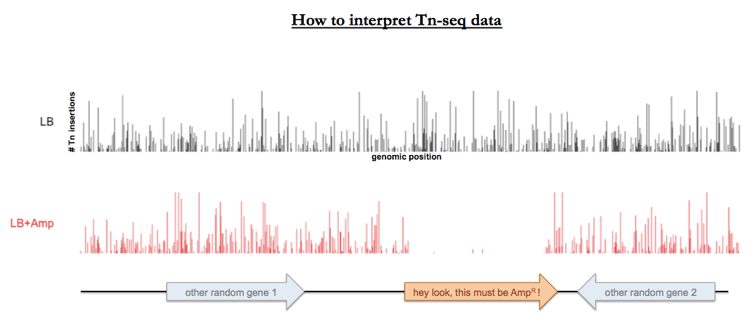
You do this with pooled sequencing for the entire transposon-mutagenized library, and you can make a plot sort of like a Manhattan plot showing the pileup of number of reads corresponding to each possible site in the genome. Sites that are represented by plenty of transposon insertions in the LB-plated pool but are depleted in the LB-plus-ampicillin-plated pool must represent mutants that died when exposed to ampicillin.†
Tn-seq has many applications beyond finding antibiotic resistance genes. For example you can also use it to study synthetic lethality (aka genetic interactions), i.e. you can find genes whose knockout is tolerated in wild-type strains but is lethal in strains with a certain other gene knocked out.
†R code for simulated Tn-seq data above:
set.seed(1)
pos = 1:1000
lb = rexp(n=1000,rate=1)
lb_amp = rexp(n=1000,rate=1)
lb_amp[500:700] = rexp(n=201,rate=5)
par(mfrow=c(2,1),mar=c(1,4,2,1))
plot(pos,lb,type='h',col='black',axes=FALSE,ylim=c(1,5),xlab='',ylab='')
mtext(side=2,text='LB',col='black',las=1,line=0)
plot(pos,lb_amp,type='h',col='red',axes=FALSE,,ylim=c(1,5),xlab='',ylab='')
mtext(side=2,text='LB+Amp',col='red',las=1,line=0)

About Eric Vallabh Minikel
Eric Vallabh Minikel is on a lifelong quest to prevent prion disease. He is a scientist based at the Broad Institute of MIT and Harvard.