Neurodegeneration seminar 1: 'Prions'
These are my notes from week 1 of Harvard’s Neurobiology 305qc course “Biochemistry and Biology of Neurodegenerative Diseases”, held by Michael Wolfe and Dominic Walsh on November 3, 2014.
Introduction
Today’s class is on PrP. Looking forward, the other six class meetings will cover, respectively, Aβ, Tau, FTD/ALS, Parkinson’s, polyQ, and a summary session. This is the first year in which this class will begin, rather than end, with prion disease. That’s in part because it now appears we understand prion diseases better than any of these others, and are closer to therapeutics.
This week’s assigned readings were [Colby & Prusiner 2011] as a backgrounder on prions, and two MRC Prion Unit papers on the kinetics of prion infection [Sandberg 2011, Sandberg 2014].
Dominic Walsh’s introduction to prions
Prion diseases are characterized by four neuropathological changes: neuronal loss, spongiform change, astrocytosis, and PrP deposits. (Some of these features are non-obligatory and/or vary by strain).
A review - Colby & Prusiner 2011
Even though this entire blog is about prions, I had never read this particular review, and I learned a few new things from it.
First, it had never occurred to me that when Carleton Gajdusek’s group first established the transmissibility of familial CJD - long before Prusiner had advanced the prion hypothesis - people assumed that the cause must be a virus transmitted in the germline, rather than a Mendelian disease mutation. Colby and Prusiner cite [Roos 1973], who states:
The transmissibility of the disease from R. C. … indicates that even the familial type of C-J disease may be caused by a virus. It may well be transmitted vertically from the parents to their children. If genetic factors do play a role, they may do so by influencing susceptibility to infection or by permitting an otherwise innocuous latent agent to produce a slowly pathogenic brain infection.
They state that this hypothesis was not falsified until Prusiner’s group showed that GSS was linked to the P102L mutation [Hsiao 1989], which strikes me as strange: even without finding the causal mutation it should have been possible to see that the disease exhibited 50/50 transmission to children of affected parents, consistent with a dominant Mendelian variant and inconsistent with viral transmission.
The authors draw a distinction between “seeded polymerization” and “template-assisted replication”:
Although some investigators argue that mammalian prions multiply by a seeded polymerization process during which PrPC is transformed into PrPSc, there is little evidence for such a process. More likely it is a template-assisted replication mechanism whereby the conformation of PrPSc is copied with a high degree of fidelity.
I don’t really understand what the distinction is here. Is “template-assisted replication” meant to imply that this is an active process managed by some chaperone such as “Protein X”? In class, Dominic Walsh also pointed out the distinction between the heterodimer model and a cooperative model, where [Eigen 1996] was the first to argue that the kinetics only work out mathematically in a cooperative model.
Finally, there were an assortment of facts I had heard at some point or another but never knew the citation for:
- Even deer in the asymptomatic stage of CWD excrete considerable amounts of prion infectivity in their feces [Tamguney 2009]
- Reported differences in long-term potentiation in PrP knockout mice reported by [Collinge 1994] were refuted by Prusiner and others in [Lledo 1996]
- The concept of “PrP*” as an intermediate state preceding PrPSc conversion was first introduced in [Cohen 1994]
- Lack of any post-translational modifications distinguishing PrPSc from PrPC [Stahl 1993]
Finally, I was reminded of the debate over whether a prion strain’s conformational stability is inversely correlated with its incubation time. In Figure 6 they show data from [Legname 2006], but I remembered Joel Watts saying at Prion2013 that he wasn’t sure his data supported this. His paper which was subsequently published [Watts 2014] says that “we did not observe a definitive relationship” between conformational stability and incubation time in Tg(BvPrP-M109) mice. When I emailed Joel, he said that the trend was, however, in the same direction as Legname’s trend, with R2 = .31, p = .2 (unpublished data reported here with his permission). In contrast, one study from another group found an opposite correlation [Ayers 2011].
Background for Sandberg 2011 and Sandberg 2014
Plateauing infectivity
Long before PrP was isolated, several studies had used classical virology techniques to examine the kinetics of infection with the “scrapie agent.” The earliest work in this area appears to be [Dickinson 1969]. Dickinson tested the infectivity of brains from mice infected with ME7 prions at various points in the incubation period by injecting them into other mice and measuring incubation time. Dickinson foreshadowed Prusiner’s later development of the incubation time bioassay [Prusiner 1982b]; although Dickinson did not go so far as to create standard curves and formally measure titer, his work showed that brains collected later in disease course caused more rapid disease in recipient mice, as you’d expect if infectivity were rising. (As an aside, that was also the paper that first identified two mouse alleles of the “scrapie incubation time” or sinc gene, which later turned out to be the PrPA and PrPB [Carlson 1986, Westaway 1987]).
After that initial work, several other investigators set out to characterize the time course of infectivity accumulation in prion-infected rodents. Because all of these studies were done by bioassays, they were expensive and time-consuming, and the number of data points collected were accordingly sparse. I couldn’t find the full text for two early studies, [Dickinson 1975and Kimberlin & Walker 1979], but below I’ve plotted the data from Sc237 in hamsters [Baringer 1983], 263K in hamsters [Kimberlin & Walker 1986], and RML in mice Bueler 1993]:
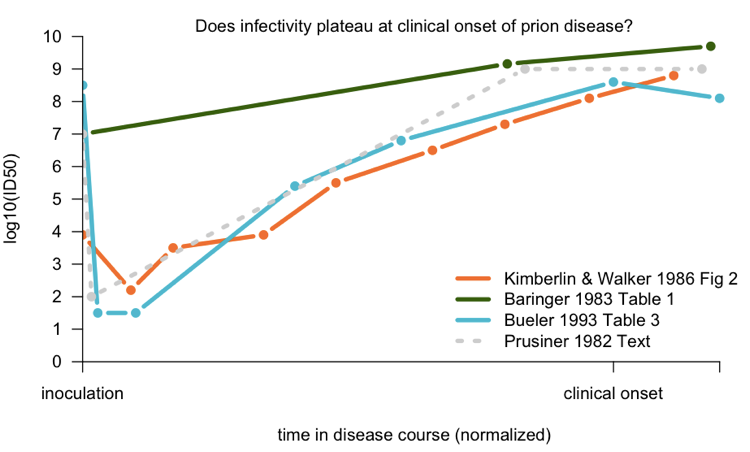
To compare the studies to one another, I normalized according to the number of days post-infection that clinical onset occurred; see my code for details. The Baringer data - from Prusiner’s group - is the average of several different brain regions which were measured. There certainly doesn’t seem to be much of an increase in the late stages, but nominally, it’s not perfectly flat. Kimberlin and Walker’s data support a continuous increase in titer, even past onset. Bueler’s data provide the best support for the idea that infectivity plateaus after onset.
As a comparison, I have also plotted, as a dotted gray line, a summary of this phenomenon given in the text of [Prusiner 1982a]:
After intracerebral inoculation of hamsters with 107 ID50 (median infectious dose) units, about 102 ID50 units can be recovered in the brain 24 hours later. During the next 50 days the amount of agent in the brain increases to 109 ID50 units. At this time the agent is widely distributed throughout the brain and no regional differences are apparent. The neuropathology is minimal and the animals exhibit no neurological dysfunction… By 60 to 70 days, vacuolation of neurons and astrogliosis are found throughout the brain, even though the titer of the agent remained constant.
— [Prusiner 1982a]
Prusiner’s citation for this was a conference abstract, [Baringer 1981], which appears to present the data later published in [Baringer 1983]. He also cites several older works, though it is not clear if any one of them contains an exhaustive treatment of the subject. In any event, although Prusiner was certainly correct - the true picture turns out to look very much like that hypothetical gray dotted line - some investigators felt that no one study had really thoroughly canvassed the issue with a large number of timepoints and conclusively shown the existence of a “plateau”. This was therefore one achievement of the Sandberg papers from this week (see below).
The fact that infectivity hits a plateau before the terminal stage is apparently peculiar. It certainly seems non-intuitive; I don’t know enough of the literature to know if this is a unique feature of prions as opposed to viruses, but a quick Google search turned up a study showing that viral titer increases continuously throughout disease in HIV patients [Piatak 1993], which is more what I’d have expected for any infectious agent.
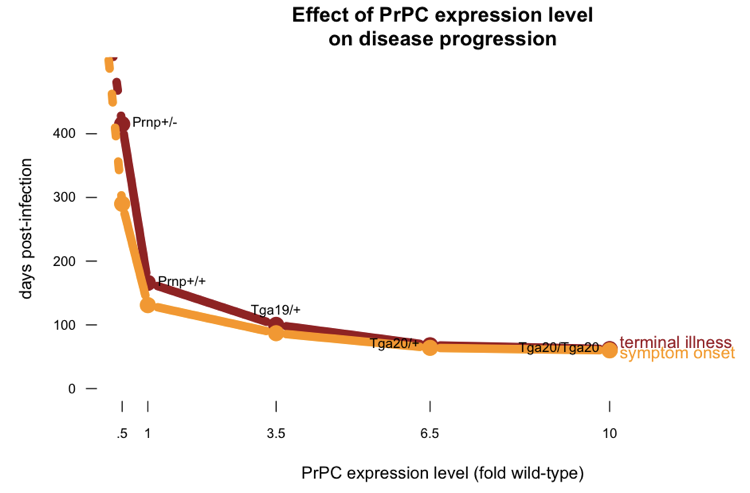
Dependence on PrPC levels
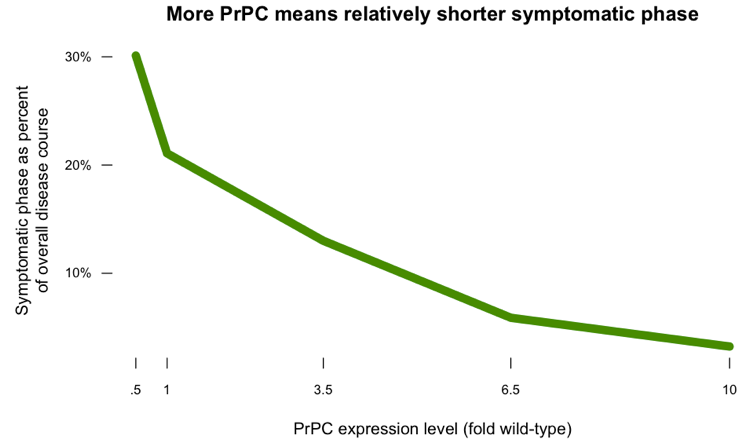
Another peculiarity of prion infection is that higher levels of PrPC expression not only lead to shorter incubation times, but also result in the symptomatic stage of disease being smaller as a proportion of the overall disease course. I’ve posted some R code which plots the data from [Fischer 1996] showing how time to symptoms, and time to death, vary as a function of PrPC expression level:
If you plot the length of the symptomatic phase as a proportion of the overall disease course, you get this:
The PrPL hypothesis
Together, these pecularities led John Collinge to propose the theory of “PrPL”: a special subspecies of PrP which is uniquely lethal:
A possible explanation is that PrPSc is itself relatively inert, but toxicity resides in a smaller, labile, oligomeric PrP species (named PrPL for lethal), generated as an intermediate or side product during prion propagation
This theory was meant to explain why a plateau of infectivity would be temporally coincident with symptoms: because a new species, PrPL, began to be produced. In addition, Collinge supposed that the rate of PrPL production was dependent on the PrPC concentration, thus explaining the shorter symptomatic phase in PrP overexpressers [Fischer 1996], as well as the cell-autonomous nature of prion toxicity [Brandner 1996].
Adriano Aguzzi and John Collinge don’t agree on much, and PrPL is no exception. Aguzzi has proposed that all of these phenomena can instead be explained by supposing that PrPC is a receptor that mediates PrPSc toxicity [Aguzzi & Falsig 2012].
Tools and techniques
The Sandberg papers discussed here use the scrapie cell panel assay [Klohn 2003] in which prion-susceptible cells are exposed to brain homogenate, then cultured for a few days, then digested with proteinase K and immunoblotted in place. Cells that became infected will form a PK-resistant speck on the blot, while uninfected cells won’t. Thus, you can measure the titer of infectivity in the original sample according to what proportion of cells leave a speck.
They also use standard PK digestion to assess the levels of PK-resistant PrPSc.
Finally, the [Sandberg 2014] paper makes the assumption that PrPC levels do not rise during prion infection. This dates back to Hans Kretzschmar’s early work showing that PrP mRNA levels are unaltered during prion infection [Kretzschmar 1986]. Charlie Mays has more recently shown that PrPC is actually downregulated during infection [Mays 2014]. Sandberg and Collinge argue this is not a problem, since it means at worst that they will underestimate the concentration of new PrP species during the late stages of infection.
Discussion of Sandberg 2011 and Sandberg 2014
These papers really go together - [Sandberg 2011] was an effort to exhasutively blanket the time course of prion disease with measures of infectivity, but its data points ended up being fairly sparse in the exponential phase (see Fig 1B). Therefore [Sandberg 2014] came back and did all the extra experiments that many of the authors’ peers had wanted them to do in the first place. Collectively, the two papers collect data indicating that:
- Infectivity in the brain rises exponentially after infection.
- The exponential rise happens more quickly in mice with higher PrPC expression levels.
- Infectivity plateaus around 108 ID50 units regardless of PrPC expression level.
- Onset of clinical symptoms occurs after the plateau in infectivity.
- The symptomatic phase of disease is shorter at higher PrPC expression levels.
None of these issues was completely unexplored prior to 2011, but this is certainly the most thorough treatment of them.
However, I am not entirely convinced by the further interpretation of these data.
First, a key take-home message is that prion disease has two separate phases:
- A phase where infectivity increases but there is no neurotoxicity
- A phase where neurotoxicity occurs but infectivity stops increasing
Yet [Sandberg 2014] Figure 5 clearly shows some (albeit limited) neuropathological changes before the time of frank clinical onset. Are these really two entirely separate phases, or two just overlapping phases?
Second, the authors make a big deal out of the notion that infectivity increase is “not rate-limited by prion protein concentration”. To me, this is semantics. It’s true that infectivity is not limited by a simple lack of any more PrPC to convert. There is always extra PrPC around, even at low expression levels. Nonetheless, the rate of exponential increase in infectivity is certainly correlated with PrPC expression level, a fact which the authors don’t discuss much.
Third, the second paper makes the following argument. Because PK-resistant PrPSc is only ever found at low absolute levels, yet total PrP increases throughout disease course, and we know PrPC levels don’t increase during disease, therefore by subtraction, PK-sensitive PrPSc (though they avoid this term) must be on the rise in the late stages of disease. By temporal association, then, these PK-sensitive conformers are implicated to be PrPL. This doesn’t acknowledge the fact that PK-resistant PrPSc, too, continues to rise into the late disease course, even if it is still but a small fraction of total PrP.
Overall, the notion that PK-sensitive isoforms of PrPSc are associated with toxicity to neurons is perfectly plausible, but these papers do not definitively prove such a link, nor provide any inroads to clarifying the molecular basis of such toxicity.

About Eric Vallabh Minikel
Eric Vallabh Minikel is on a lifelong quest to prevent prion disease. He is a scientist based at the Broad Institute of MIT and Harvard.