Organic chemistry 30: Infrared and ultraviolet spectroscopy
These are my notes from lecture 30 of Harvard’s Chemistry 20: Organic Chemistry course, delivered by Dr. Ryan Spoering on April 22, 2015.
This lecture relies heavily on slides. With Dr. Spoering’s permission, I have uploaded a scan of today’s handout here.
Introduction to spectroscopy
Spectroscopy is the absorption of light by molecules. Spectroscopy is ultimately the only way we know anything about structures. The development of spectroscopy, especially NMR, over the course of the 20th century was as important to synthesis as the discovery of the synthesis reactions themselves.
Today we’ll look at infrared and ultraviolet spectroscopy, which are the most straightforward types of spectroscopy, basically asking what it means to absorb a photon at a particular wavelength. Most of the rest of the class will be on NMR.
Almost every part of the electromagnetic spectrum does something useful for chemistry:
- Wavelengths (λ) < 10-9 are gamma and X-rays, useful in X-ray crystallography.
- λ 10-6 to 10-9 is ultraviolet, which we’ll discuss today
- The visible spectrum is entirely within the 10-6 order of magnitude
- λ between 10-6 and 10-4 is infrared, which we’ll also discuss today
- λ 10-4 to 10-1 is microwaves, which can be used to introduce rotation, particularly for very small molecules
- λ > 10-1 is radiofrequency, used in NMR
UV spectroscopy
In IR and UV spectroscopy, you excite molecule from its ground state to an excited state using a photon, whose energy is written hν. If we have a system with a HOMO of Ψ1 and a LUMO of Ψ2, where the difference in energy of these two orbitals is denoted ΔE. When a photon with energy hν = ΔE hits the molecule, one of the two electrons in Ψ1 will jump up to Ψ2.
ΔE = hν = hc/λ
- h is Planck’s constant in J·s
- λ is wavelength in m
- ν is frequency in waves per second or s-1
- ΔE is change in energy in J
UV spectroscopy is most useful for looking at molecules that have conjugation. As you increase conjugation, the HOMO-LUMO energy gap (ΔE) narrows. Thus, etheylene has peak absorbance at λmax = 171 nm, whereas buta-1,3-diene has a lower energy difference with λmax = 217 nm:
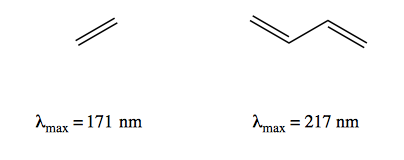
At the high end like 171 nm you start to run into wavelengths where glass and pyrex will absorb, which means if you want to make measurements here you have to use vessels made of quartz, which is a pain. So UV spectroscopy is more useful at the longer wavelengths such as 217 nm.
UV spectroscopy can be used as a fingerprinting method - for instance, the way 11-cis-retinal (the rhodopsin conjugated to opsin in cattle retina) was discovered was that they synthesized every possible E and Z isomer of this molecule until they found one with the right absorbance.
In conjugated systems the energy difference being observed is usually a π→π* change, though in some molecules you can observe a n→σ* or n→π* jump.
In the time of Woodward, who completed the landmark synthesis of chlorophyll [Woodward 1960] there were many efforts to come up with empirical rules to predict the UV absorbance of a structure, such as the Woodward-Fieser rules or the Fieser-Kuhn rules. However, overall the usefulness of UV spectroscopy is very limited.
IR spectroscopy
Vibrational modes
In a simple diatomic molecule, say HCl, the bond length stretches and contracts according to a vibrational mode called a symmetric stretch. This means that the molecule’s dipole, which is not symmetric, is oscillating. This means that if an IR photon arrives and its frequency of radiation matches the frequency of the bond’s vibration, they can interact and excite the molecule to the next higher energy vibrational mode.
CO2 can get thermally excited in three different ways:
- Symmetric stretching: the two C=O bonds stretch and contract simultaneously.
- Asymmetric stretching: one C=O bond stretches while the other contracts, and vice versa - they are out of phase. Thus, it lind of looks like the carbon is bouncing back and forth between them.
- Bending: the carbon rises while the oxygens fall, and vice versa.
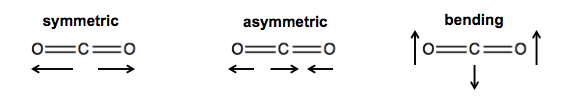
The symmetric stretching in CO2 is IR inactive. The other two are IR active and you will see them in IR spectroscopy.
Functional groups each have their own distinct vibrational modes. IR is in terms of wavenumber which is just a frequency measuremnet but in a weird unit, cm-1. C-H stretches have the highest wavenumbers, in the high 2000s, C-H bends are in the mid-1000s, C-C stretches are very weak and usually undetectable, and C-H rocking gives the smallest wavenumber, in the 700s. See the example of dodecane in the handout.
The region from wavenumber 1500 on down is known as the fingerprint region because it contains a lot of complicated vibrational modes that are very hard to predict computationally, but which are highly reproducible emprically. So although you cannot usually guess a novel structure based on its fingerprint, once you’ve seen a structure you can recognize it again in the future.
On IR spectra you will also see overtones for strong vibrational modes. For example if you have strong absorbance at 900 cm-1, it will give an overtone at 1800 cm-1.
Alkenes and alkynes are particularly easy to read - C=C has a pronounced stretch at 1650 cm-1, and C≡C has one at 2100 cm-1.
-OH groups give a broad spectrum at ~3300-3440 cm-1. Because of hydrogen bonding this is wide rather than sharp, representing all the different hydrogen bond possibilities. C=O have a very strong stretch at ~1700 cm-1 due to the strong dipole. The exact peak wavenumber depends on the X group bound to the carbonyl:
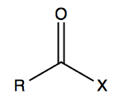
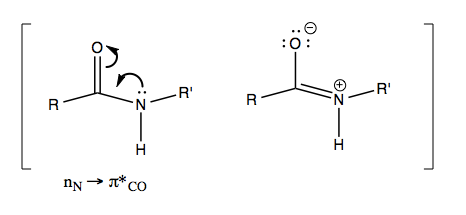
In the handout there is a table of what wavenumber you get depending on what X is - ranging from 1869 cm-1 for F to as low as 1650 for amides (-NHR). It is so low for amides because these actually have a resonance structure where the C=O bond loses some of its double bond character:
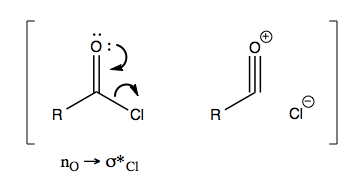
With carbonyls adjacent to halogens you get particularly high wavenumber because there is a resonance structure where the C=O bond becomes a C≡O bond (yielding an acylium ion) and the halogen leaves:
Discussion
Observe that UV spectroscopy can be useful for fingerprinting a molecule to see if two molecules are the same, but can’t really tell you a whole structure from scratch. IR spectroscopy can give you a lot of information about functional groups, but usually no more detail than that - for instance, maybe you can tell that a molecule contains an amide and a C=C bond, but you have no idea how these are configured relative to each other.
If you actually need to figure out a molecule’s whole structure empirically, then, your only option is NMR, which we’ll discuss in the coming lectures.

About Eric Vallabh Minikel
Eric Vallabh Minikel is on a lifelong quest to prevent prion disease. He is a scientist based at the Broad Institute of MIT and Harvard.