Organic chemistry 31: Proton NMR spectroscopy
These are my notes from lecture 31 of Harvard’s Chemistry 20: Organic Chemistry course, delivered by Dr. Ryan Spoering on April 24, 2015.
This lecture relies heavily on slides. With Dr. Spoering’s permission, I have uploaded a scan of today’s handout here.
Proton (1H) nuclear magnetic resonance (NMR) spectroscopy
NMR gives us three different types of information:
- Chemical shift (δ)
- Peak integrals (literally integrals - area under the curve)
- Spin-spin coupling tells you what is near each other
NMR relies on nuclear spin states that have very small differences in energy. Most common nuclei actually lack nuclear spin. 12C and 16O have no net spin because all nuclear particles are paried (equal number of protons and neutrons), thus I=0. Only nuclei with unpaired particles have net spin - for instance, 1H, 13C, 19F, and 31P are all I=½ nuclei. I=½ means that the nucleus can be in either of two possible spin states {½, -½}. Normally this doesn’t matter - it only starts to matter in a magnetic field. 1H can be thought of as a spinning charge, which gains a magnetic moment. A +½ spin state is spinning ↺, so its moment is ↑, while a -½ spin state is ↻ with a moment ↓. If you then place this proton in a magnetic field with B0 pointed ↑, then the +½ spin state is pointed in the same direction as the magnetic field, thus it has lower energy, while the -½ spin state is against the field and has slightly higher energy. The energy difference ΔE between these two states is incredibly small. In normal conditions on Earth, the Boltzmann distribution dictates that protons are divided almost exactly 50/50 between the two states, with an excess of only 1 or 2 atoms per million in the lower energy state.
E.M. Purcell shared the 1952 Nobel Prize in Physics for developing NMR as a way to determine molecular structures. He noticed that proton resonance in ethanol had three different signals, which he figured out was due to chemical shift. Where there exists an electron cloud, it shields a proton from the effects of the magnetic field B0, allowing the proton to experience an effective magnetic field Beff whose strength is reduced. He figured out that you can apply radiation in the radiofrequency range, and then vary the strength of the magnetic field, and only when the ΔE for a particular nucleus’s two spin states matches the radiation, it will absorb that radiation. The “high field” or “upfield”, by convention plotted toward the right on the x axis in NMR, but corresponding to lower numbers, refers to more shielding, while “low field” / “downfield”, the left side of the x axis but higher numbers, is less shielded nuclei.
In ethanol, the electronegative oxygen pulls electron density towards it, with the result that protons near the oxygen get deshielded. The hydrogens furthes from the oxygen enjoy more of their full shielding. So the protons in CH3 are most shielded (upfield), the protons in the CH2 are intermediate, and the H bonded directly to O is least shielded (downfield).
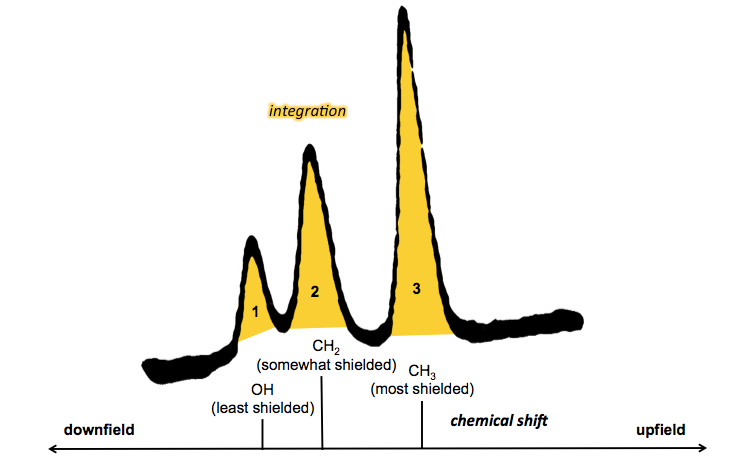
Thus, in the 1H NMR spectrum of ethanol, the location of the three peaks (chemical shift) tells us about shielding, while the integration (area under each peak) tells us how many hydrogen atoms exist at each level of shielding.
Tetramethylsilane (TMS) is by definition 0 on the frequency spectrum - the hydrogens on the methyls represents the most upfield / shielded protons in the spectrum. The location of other peaks is measured as δ relative to TMS, in units of parts per million (ppm). This unit is designed to make the δ measurements independent of the magnetic field strength. The stronger the magnetic field, the larger the difference in energy between spin states, and the larger the chemical shift observed - hence the need to normalize. ppm is calculated as chemical shift in Hz over magnetic field strength in MHz, hence the “parts per million”:
ppm = δ (Hz) / B0 (MHz)
The first time that NMR was actually used to solve a scientific problem was when E.J. Corey at University of Illinois used it to figure out he had synthesized cycloheptatriene. This was discernible on NMR thanks to the integration indicating that there was a 3:1 ratio of hydrogens on sp2:sp3 hybridized carbons. In those days, the NMR spectra were plotted on graph paper so that you could count the squares in order to measure area under the curve. Another method was to use a scissors to cut out the area under the curve and then weigh it on a scale.
Each peak on NMR arises from either 1 proton, or 1 chemical shift equivalent (CSE) set of protons. Protons can be equivalent if they are:
- Homotopic
- Enantiotopic
- Exchangeable in some rapid chemical process
Inequivalent protons are either:
- Totally unrelated
- Diastereotopic
- Exchange is hindered
Sometimes protons look as though they should be equivalent, but in fact there is some conformational or other hindrance which causes them to split out into separate signals.
When one views an NMR spectrum, one will first look at chemical shift and integration in order to make a first guess, a first proposal as to what the structure may be.
Today’s handout contains several practice problems where you see a spectrum and have to guess what the molecule is.
- A has a single peak in the aromatic CH range. This has to be an aromatic with all hydrogens equivalent. It could be a benzene. Or it could be benzene with a symmetric distribution of methyl or other alkyl groups. For instance, three methyls (one at every other carbon), or two methyls at opposing ends. Or CHCl3. It turns out that the exact position of the chemical shift tells you it is in fact benzene.
- B has a single peak in the alkynyl CH range. Acetylene would be one option, though as a gas it is hard to do NMR on. It could instead be acetylene with one of the H substituted for a proton-less R group. Another option is since it is also within the benzylic range, it could be hexamethyl benzene, such that all hydrogens are bonded to a benzylic carbon (the core aromatic ring has no hydrogens of its own). It’s also in the carbonyl range. In fact, it turns out this is acetone - there are 6 hydrogens, 3 each on 2 methyl groups bound to a carbonyl carbon.
- C has two peaks. Although the downfield peak is shorter, it is also wider, such that its area under the curve is actually larger than the upfield peak, with a ratio of 5:3. This is toluene. The three hydrogens on the benzylic carbon are equivalent to each other and are the upfield peak. The five hydrogens on the aromatic ring are close but not perfectly equivalent to each other because they have para, meta, and ortho positions - that is why the peak is slightly spread out.
- D has two peaks with a 2:3 ratio of area under the curve. This could be a 5-hydrogen molecule, but if you think about it, there are only two main ways to have a molecule with an odd number of hydrogens - either you have a halogen replacing one hydrogen, or you have an odd number of nitrogens. It turns out this is actually a 10-hydrogen molecule with ratio 4:6, and the molecule is diethyl ether.
- E has three peaks with a 1:1:6 ratio. The 6H peak is in the sp3 alkyl CH range, so probably represents two methyl groups. The most downfield peak represents an -OH. The middle peak represents an H bound to a central carbon. This molecule turns out to be isopropanol.
- F has three peaks with a 2:3:3 ratio. This looks like an electronegative atom bound to CH2 bound to CH3. Then there is another peak in the CH3 region, next to something slightly electron-withdrawing. This is ethyl acetate.
The rest of them are left as an exercise.

About Eric Vallabh Minikel
Eric Vallabh Minikel is on a lifelong quest to prevent prion disease. He is a scientist based at the Broad Institute of MIT and Harvard.