Organic chemistry 33: Mass spectrometry
These are my notes from lecture 33 of Harvard’s Chemistry 20: Organic Chemistry course, delivered by Dr. Ryan Spoering on April 29, 2015.
This lecture continues the slides from last time.
Mass spectrometry
Mass spec is a fancy way of measuring the molecular weight of ions in your sample. It is where molecular formulas (the number of atoms of each element in a molecule) come from in the modern day.
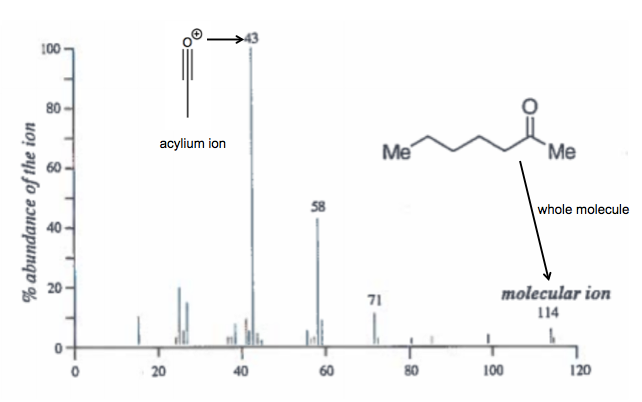
The slides show an electron impact mass spectrum of 2-heptanone. The whole molecule is 114, the acylium ion is 43:
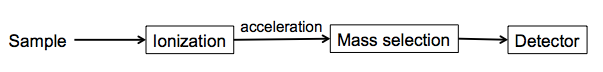
You use some device that will ionize your molecule, and the ions will get accelerated to a speed related to their mass and charge, the mass selected before they hit a detector:
There are a variety of ways of ionizing the sample:
- EI
- CI
- ESI
- FAB
- MALDI
CI, ESI, and FAB are intended to minimize fragmentation, so that you only get a signal from the whole intact molecule. MALDI is intended for very large molecules. EI is considered very harsh and would be used only if you are specifically interested in a fragmentation.
The mass selection can also be done in several ways:
- Mag sector (magnetic)
- Time of flight (a.k.a. TOF)
- Quadrupole
In EI ionization, your sample passes by an electron beam, which knocks electrons out of the molecle, forming radical cation species denoted M·+. Note that it is both charged (+) and is a radical (·). Because it is charged, it now accelerates. It will ionize into separate molecules, one with the radical and one with the formal charge, denoted A· and B+. The angle at which the ion flies will depend on its charge and its mass (more mass means more inertia, so it will turn more slowly), so by varying the magnetic field and having only a small slit through which the ions can fly, you can narrowly select for a particular mass/charge (m/z) ratio.
What you see at the detector is a single ion. If you can measure its molecular weight to four decimal places, which you can, you can uniquely identify every possible molecule.
Bromine is almost a 50/50 mix of 79Br and 81Br. So on a mass spectrum of, say, bromobenzene, you’ll see two peaks for every ion that contains bromine - one peak for the fragments that contain a 79Br and one for those that contain 81Br.
1H NMR spin-spin coupling continued
Last time we discussed styrene:
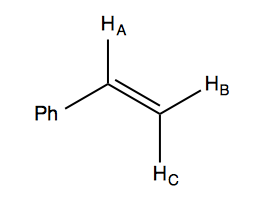
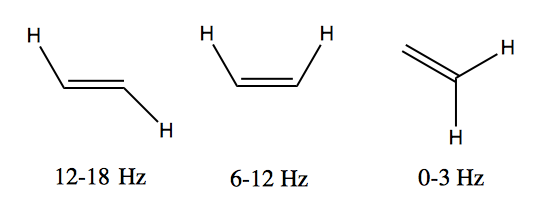
The J (coupling constant) value for trans alkenes is usually 12-18 Hz, while for cis alkenes it is usually 6-12 Hz. Therefore 12 Hz is a pretty good cutoff to decide whether the arrangement in your molecule is cis or trans.
In styrene, HA and HB are in cis to each other, while HA and HC are in trans to each other. It turns out that JAC = 18 Hz and JAB = 11 Hz. This means the two levels of the tree that splits HA have unequal spacing, so there are two ways you can draw it:
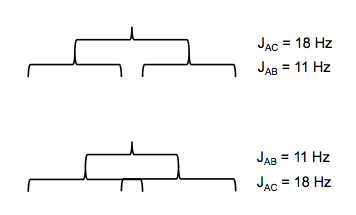
JBC is only 1 Hz, which leads to a tiny splitting of the HC and HB peaks, each of which is a doublet of doublets.
Use of deuterium
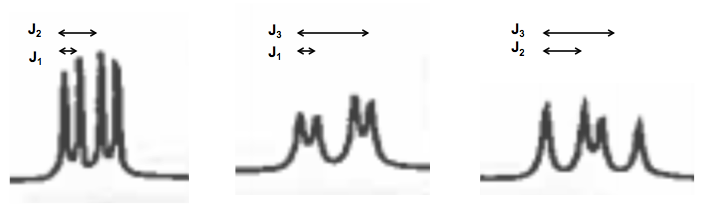
The slides show an NMR spectrum of cysteine in D2O. Deuterium has no spin, so any hydrogen that is exchangeable, such as an acid or alcohol or something, will get exchanged for deuterium and give no signal on NMR. This is a useful trick.
By staring closely at the cysteine NMR spectrum you can make out three different coupling constants at work across the three chemical shifts:
Longer-range coupling
Sometimes you can see longer-range coupling as opposed to just vicinal or geminal. In alkynes you can get 4-bond propargylic coupling at 2-3 Hz. In aromatics there is 4-bond meta coupling.
13C NMR
NMR can be used with many other atoms besides 1H. We’ll just briefly discuss 13C. Here, each peak represents a carbon or a chemical shift equivalent set of carbons. The leftmost end, downfield, represents carbons that are more deshielded. Carbonyls are furthest downfield, carbons adjacent to oxygen are in the middle, and plain alkane carbons are farthest upfield.
The limitation of 13C NMR is that 13C represents only 1% of carbon in nature, so your entire signal comes from just 1% of your sample. Therefore you need a lot more sample in order to do this, and even then, you won’t have as much power as with 1H NMR. In particular, the chance of two 13C being adjacent to each other is .012, which is negligible, so you essentially see no coupling in your 13C NMR spectra.
13C NMR can be used in 2-dimensional NMR methods such as correlation spectroscopy. You can take a 13C NMR spectrum and a 1H NMR spectrum and plot them against each other to figure out which hydrogens are on which carbons. This is useful in protein structure determination, though that is beyond the scope of this course.

About Eric Vallabh Minikel
Eric Vallabh Minikel is on a lifelong quest to prevent prion disease. He is a scientist based at the Broad Institute of MIT and Harvard.