Chemical biology 06: screening for drug discovery, target identification
These are my notes from lecture 6 of Harvard’s Chemistry 101: Chemical Biology Towards Precision Medicine course, taught by Dr. Stuart Schreiber on September 22, 2015.
Today’s readings are on gene expression signatures [Peck 2006] and using proteomics for small molecule target identification [Rix & Superti-Furga 2009]. Additional readings include perspectives on high-throughput screening [Mayr & Fuerst 2008, Kodadek 2010], repurposing [Chong & Sullivan 2007], and a target identification example from Steve Haggarty’s group [Kuai 2011].
Today’s lecture covers two topics: screening to discover small molecules as drugs for human disease, and target ID.
Screening
Small molecule screens can be broadly grouped into two categories:
- Target-based. Screening with purified proteins to find a molecule that binds a specific desired target.
- Phenotypic. Screening with whole cells or organisms to find a molecule that gives a desired outcome, without knowing in advance what target will give you that outcome.
In an ideal world, experiments of nature, via human genetics, would tell us all the targets we need to hit, and exactly how we need to modulate their function. Then we could just do target-based screens for everything. For instance, it has been reported that APP A673V increases Alzheimer disease risk [Giaccone 2010] while A673T decreases risk [Jonsson 2012]. It is claimed that A673T APP is impaired in β-cleavage [Jonsson 2012], though the functional evidence for this is still debated. For the sake of argument, assume that this is correct. Then we just need to find a small molecule that mimics the effect that A673T has on β-cleavage.
In practice, though, we don’t know all of the targets, it is amazing how often we are humbled by the unexpected findings that arise from phenotypic screens.
Methods for target-based screens include label-free methods:
- Mass spectrometry-based methods
- NMR-based methods
- Thermal shift or calorimetry-based methods
- Affinity-based methods
Then there are methods that require labeling either the small molecule or the protein:
- Surface plasmon resonnace
- Small molecule microarray
Small molecule microarray has many shortcomings, including that the covalent attachemnt of the small molecule to the slide may preclude it binding the protein, thus giving you false negatives. But you just have to hope that you still get some real positives. Small molecule microarray has been used to discover haptamide B [Koehler 2003], an inhibitor of a transcription factor, which would classically be considered an undruggable target.
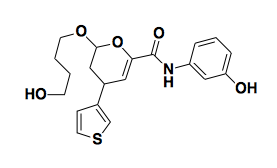
Above: haptamide B, an inhibitor of a transcription factor.
An NMR-based method involves looking for chemical shifts in NMR when your protein is exposed to a molecule. This requires very high concentrations of compound (like 1mM) and the hits tend to be extremely small structures, so it is often called “fragment-based screening”. You can use this method to find a fragment with some affinity, albeit not much, and then work to build it up in 3D space and find more potent analogues containing your original fragment.
Here are some examples of phenotypic screens.
- The natural product rapamycin (also known as Sirolimus) is approved as an immunosuppressant for individuals with organ transplants. Unfortunately, a subset of patients treated with rapamycin develop type II diabetes as a side effect. Rapamycin results in dephosphorylation of a particular protein, so this was used as the phenotype for a phenotypic screen for compounds that would reverse the “diabetic-like” state of the rapamycin-treated cells. The hits that were discovered turned out to act by modulating autophagy, which was an unexpected outcome.
- Steve Haggarty wanted to find small molecules that would block the pathway where by neuregulin (Nrg1) binds ErbB4. PC12 cells do not express ErbB4, and nothing happens if you dump neuregulin on them. If you transfect them to express ErbB4, then they start responding to Nrg1, and their response is to grow neurites, which is a phenotype that can be discerned visually. They therefore expressed ErbB4 in these cells, added Nrg1, and then screened for small molecules that would prevent the neuritic phenotype from emerging [Kuai 2011].
- Prostate cancers can be classified into androgen receptor-dependent and -independent, also known as castration-dependent and castration-independent. AR-dependent prostate cancers have different gene expression profiles when they have AR, versus when they are deprived of AR signaling. You can build a classifier based on just 64 transcripts, which is a number of transcripts whose abundance you can quantify using Luminex bead-based technology in 384-well plates. So Todd Golub and colleagues looked for compounds that would cause AR-dependent cells exposed to androgen to adopt a gene expression signature that looks more like if they were deprived of androgen [Hieronymus 2006]. It turns out that their top lead compound, celastrol, induces AR degradation.
- Ewing sarcoma (EWS), a cancer of children, is caused by a fusion protein created by a translocation. Kim Stegmaier characterized the gene expression profile of Ewing sarcome cells (known as EWS/FLI cells) in the baseline state and in the presence of siRNA against the fusion transcript. She then screened FDA-approved drugs for ones that would cause EWS/FLI cells to adopt a state consistent with fusion transcript knockdown. Incredibly, she found that an FDA-approved drug called Ara-C, also known as cytosine arabinoside, or cytarabine, had just this effect [Stegmaier 2007]. This led swiftly to a clinical trial [NCT00470275]. Unfortunately, the results so far indicate some hematologic toxicity and no evidence for efficacy [DuBois 2009].
- If you have a small enough model organism, such as zebrafish, you can do whole-organism phenotypic screens. Randy Peterson created zebrafish with an embryonic lethal mutation called gridlock that causes the aortal valve to never open during cardiogenesis, as a model of the huamn condition called “congenital narrowing of the aorta”. Then he did a visual phenotypic screen for compounds that would reverse this phenotype [Peterson 2004].
- Zebrafish also develop an ear-like structure called an otolith. Fish lacking an otolith can’t swim straight. A measurement of straight-line swimming was used as a phenotype to look for compounds that would prevent otolith formation [Peterson 2000]. This revealed a tool compound that prevents otolith formation only if it was administered from hour 8 to 26 of development. If it was administered from hour 14 to 26 you got partial otolith development. This sort of timing experiment could not be done with genetic methods, so having a probe was essential. The target is still unknown.
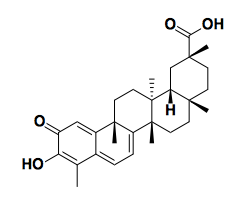
Above: celastrol, a natural product isolated from the Chinese medicinal herb 雷公藤 that mimics the gene expression signature of androgen deprivation in prostate cancer cells [Hieronymus 2006].
Developing an assay is really hard. First, you need a positive control, which can sometimes be hard to find. Sometimes it could be a genetic positive control rather than a small molecule. Then you need a crisp separation between the distribution of positive control measurements and negative control measurements, known as a Z prime (Z’) or Z factor [Zhang 1999]. The Z factor is a measurement of the distance between 3 standard deviations below the positive mean and 3 standard deviations above the negative mean:
\[Z' = 1 - \frac {3\sigma_{positive} + 3\sigma_{negative}}{|\ \mu_{positive} - \mu_{negative}\ |}\]The ideal value is 1, indicating perfect separation. In practice that never happens. But if you have a Z’ ≤0 you have a very poor assay indeed.
Target ID
Once you have identified a probe that is active in a phenotypic screen, how do you determine its mechanism of action? Here are some methods that have been used:
- If the phenotype in question is death of pathogenic microbes or cancer cells, then add your compound in sublethal doses, gradually increasing, and then perform sequencing on the resulting drug-resistant colonies. You may identify a recurrently mutated gene that is likely to be the target.
- Perform a genetic perturbation screen (siRNA, etc) to find genes whose knockdown modifies the effect of the compound.
- Mine databases for connectivities. (Presumably this refers to looking for siRNAs, or other probes with known targets, that yield similar profiles as your compound in gene expression space or something. I think this is the topic of the next lecture.).
- Quantitative proteomics.
There are two main methods in quantitative proteomics — SiLAC and iTRAC. In SILAC (stable isotope labeling of amio acids in cell culture) you grow cells in regular media or heavy (D2O) media. In the light media, you pre-incubate cells with your compound. In heavy media, you do not pre-incubate. Then in either case, you expose cell lysates to beads conjugated to your compound. In light media, the target has already been bound, so should exhibit minimal binding to beads. In the heavy media, the target is unbound and should bind readily to the beads. Then you combine the beads, wash them, boil them in SDS, and then trypsinize the proteins that were bound. Any tryptic peptides from proteins that just non-specifically stick to the bead should be equally abundant in heavy and light space (distinguishable in your proteomics data by the mass shift due to deuterium). But your target should be vastly enriched in heavy space compared to light space. This method has been used to go back and figure out how specific various kinases are. For instance, Ro-31-7549, once believed to be highly selective for protein kinase C (PKC), has now been shown to have strongest affinity for PKC but to also bind many other kinases.
A hot new method is cellular thermal proteome profiling (TPP) [Savitski 2014]. This is a method to identify targets in whole cells. It relies on the idea that soluble proteins become insoluble when they are denatured. As you heat cells, proteins bound by compound will be stabilized and will have their melting points increased. So the target of your compound should be a protein whose melting curve is shifted up in the presence of the compound. You measure that melting curve by centrifuging the cell lysates after compond treatment and then measuring the abundance of proteins in the supernatant. This doesn’t work for membrane-bound proteins, which will pellet out regardless.
Addendum 2015-10-21: another method worth knowing is drug affinity responsive target stability (DARTS) [Lomenick 2009], where basically you look for proteins that become relatively more protease-resistant in the presence of the compound, because apparently often compound binding can do that.

About Eric Vallabh Minikel
Eric Vallabh Minikel is on a lifelong quest to prevent prion disease. He is a scientist based at the Broad Institute of MIT and Harvard.