Biochemistry 08: the citric acid cycle and the electron transport chain
These are notes from lecture 8 of Harvard Extension’s biochemistry class.
quick review of mitochondrial structure
To understand this post, it’s useful to know the mitochondrial structure (see also Cell Biology 03). Here’s a rad CC BY Wikimedia Commons diagram by Kelvinsong & Sowlos:

citric acid cycle
Khan Academy’s introduction:
The citric acid cycle or Kreb’s cycle is the cell’s metabolic hub, as it not only generate energy from pyruvate (the product of glycolysis) but along the way also can consume and produce metabolites relevant to host of other processes. It’s called a “cycle” and not a “pathway” because it both begins and ends with oxaloacetate. It takes place inside the mitochondrial matrix.
Pyruvate from glycolysis does not enter directly into the citric acid cycle. First it passes through a “transition phase” where it is undergoes oxidative decarboxylation to CO2 at the hands of the pyruvate dehydrogenase complex, transferring acetyl groups to coenzyme A to yield acetyl-CoA. This can be considered as step 0 and is depicted at the top of the below diagram. Pyruvate dehydrogenase deficiency causes a neurodevelopmental disorder and can result from mutations in many of the different genes involved in the complex.
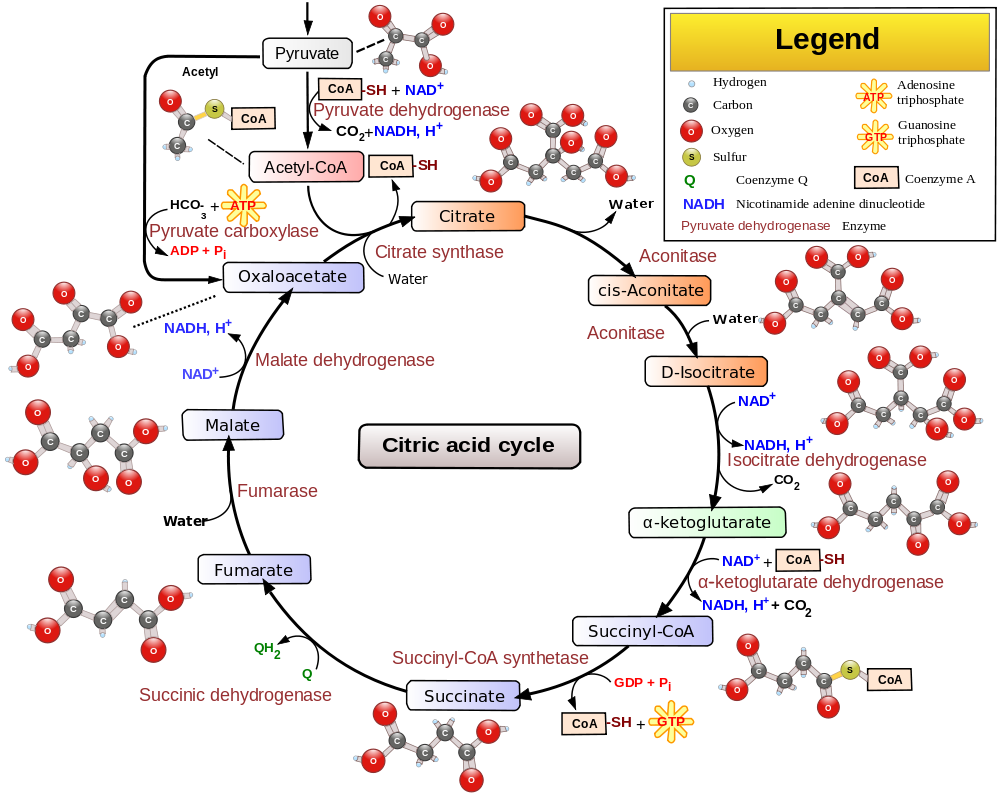
Source: this is a Wikimedia Commons featured image by multiple authors.
What’s not depicted in this diagram is there are a few ways to enter the CAC. Pyruvate can come either from glycolysis or amino acid catabolism. Amino acid catabolism or fatty acid catabolism can also yield acetyl-CoA directly.
As the pyruvate dehydrogenase complex is the chief entry point into the CAC, its proper regulation is key for controlling the rate of cellular energy production. It is tightly regulated by allosteric regulation by products of the CAC / electron transport chain:
| inhibited by | activated by |
|---|---|
| NADH Acetyl-CoA ATP |
NAD+ CoA AMP |
tl;dr: when ample fuel is available, i.e. the [ATP]/[AMP] ratio and [NADH]/[NAD+] ratios are high, there’s no need to continue running the cycle.
Three other highly exergonic CAC steps are also checkpoints for regulation: citrate synthase, isocitrate dehydrogenase, and the alpha ketoglutarate dehydrogenase complex. Orthogonally, you can think of 4 main mechanisms by which the CAC is regulated:
- substrate availability. availability of oxaloacetate and acetyl-CoA as inputs.
- product inhibition. for instance NADH not only inhibits the pyruvate dehydrogenase complex (above table) but also inhibits other regulatory steps.
- allosteric activation. for instance ADP (whose accumulation is a sign of energy need) activates enzymes such as the pyruvate dehydrogenase complex (above table)
- competitive feedback inhibition. for instance, succinyl-CoA, an intermediate, competes with acteyl-CoA for the attention of citrate synthase.
It also makes sense to have glycolysis and CAC running at about the same rate (think just in time delivery), so there’s a mechanism for their co-regulation. Citrate, an intermediate in the CAC, inhibits PFK-1, a step in glycolysis.
The CAC is described as “amphibolic” because it is both catabolic and anabolic – it both produces and consumes intermediates relevant to a host of other pathways. Here’s a video describing these roads in and out of the CAC. The diagram at 0:06, which should be the thumbnail below, is a concise overview.
Pyruvate can actually feed into the cycle in two ways. As discussed above, it can be spent on creating acetyl-CoA. Think of that as submitting a job to the computing cluster. Pyruvate can also be converted to oxaloacetate by pyruvate carboxylase- think of that as adding a node to the computing cluster. In other words, while acetyl-CoA is just consumed in the CAC, oxaloacetate is consumed and then regenerated (the cycle starts and ends with it), and so the amount of oxaloacetate available can be limiting and thus determine the number of instances of the citric acid cycle that can run in parallel. Converting pyruvate to oxaloacetate and thus increasing the number of parallel CAC jobs is a way of increasing the rate at which intermediates are produced for other cellular processes. This is especially important when intermediates are being rapidly siphoned off for other processes, causing acetyl-CoA to accumulate while very few of the CAC cycles are actually running to completion. Under this circumstance, acetyl-CoA feeds back to activate pyruvate decarboxylase, thus causing more OAA to be generated and more CAC cycles to run in parallel.
That process is especially important in the liver and kidney because they perform gluconeogenesis. In this process, intermediates from other processes enter the CAC and then oxaloacetate is siphoned off to create glucose. Under these conditions, the CAC is not replenishing its own supply of OAA, and so pyruvate carboxylase activity is key. This activity is higher in the liver and kidney than elsewhere.
The CAC’s contribution to cellular ATP supplies is indirect. It produces NADH, FADH2, and GTP, which enter the electron transport chain to produce ATP. Here’s a diagram I made of how ATP is produced in glucose metabolism:
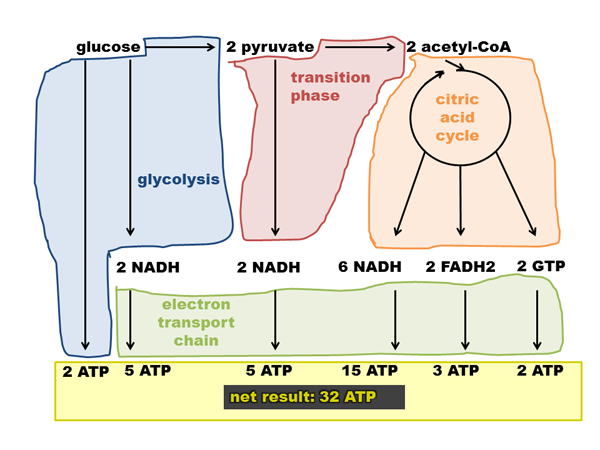
Note that this depicts a production of 32 ATP / glucose. The exact figure depends on things like the leakiness of membranes and such, see discussion on Wikipedia. The theoretical maximum is 38 ATP, some people think the actual figure is closer to 29 or 30. The above graphic assumes 2.5 ATP/NADH and 1.5 ATP/FADH2.
quick review of oxidative phosphorylation
Glycolysis and the CAC both oxidize fuels to CO2 in order to reduce NAD+ to NADH and FAD to FADH2. In the electron transport chain, NADH and FADH2 are then exergonically reoxidated to release the energy which will be used to oxidatively phosphorylate ADP to ATP. In the electron transport chain, e- are transferred through multiple complexes to ultimately reduce O2 to H2O.
Remember that redox is the transfer of electrons. Q is ubiquinone, popularly known as CoQ10. QH2 is called ubiquinol.
NADH + Q ↔ NAD+ + QH2
A substance’s tendency to accept electrons is quantified as its reduction potential, denoted ε°’. Electrons flow spontaneously from the substance with the lower reduction potential to the substance with the higher reduction potential. For example, Q’s ε°’ is .045, and NADH’s is -.315, so electrons will flow from NADH to Q. You can add the half reactions together to get the reduction potential for the whole reaction:
| reaction | reduction potential |
| Q + 2H+ + 2e- ↔ QH2 | ε°’ = .045 V |
| NADH ↔ NAD+ + 2H+ + 2e- | ε°’ = .315V |
| NADH + Q ↔ NAD+ + QH2 | Δε°’ = .360 V |
Note that in the second line, both the equation and the sign of the reduction potential have been swapped.
Gibbs free energy and reduction potential are related as follows:
ΔG = -nFΔε
Where F = one Faraday, a constant equal to 96,485 J/(V·mol) and n = number of moles of electron transferred per mole of reactant. ΔG is large and negative when Δε is large and positive. Thus electrons flow from compounds with low ε to compounds with high ε. Their desire to do so is what drives ATP production in the electron transport chain.
electron transport chain
Khan Academy’s introduction:
The electron transport chain’s ultimate purpose is to create a proton gradient which is then used to drive ATP production. The mitochondrial outer membrane is porous, so the intermembrane space has the same ionic composition as the cytosol. The ETC creates a proton gradient across the inner membrane.
To do this, it transfers “reducing equivalents” from the cytosol into the matrix via the malate-aspartate shuttle system. Also the adenine nucleotide translocase moves ATP out of the matrix and brings ADP into the matrix. Pi used to create more ATP in the matrix is imported via an H+ symporter which takes advantage of the proton gradient.
In the electron transfer chain, electrons flow from Complex I to Complex II to Q to Complex III to cytochrome c to Complex IV. This series of complexes trades electrons in a way that allows e- to migrate up to higher and higher reduction potential (i.e. the direction they want to go). The final step is reduction of O2 to H2O. The energy release at some steps pumps H+ into the intermembrane space.
Complex II, which is succinate dehydrogenase, does not directly contribute to the proton gradient, but it is another source of electrons. It oxidizes succinate to fumarate, thus reducing FAD to FADH and then using FADH to reduce Q. It thus contributes electrons to the “quinone pool”.
Complex III conducts the Q cycle. Ubiquinone (Q) is reduced to the semiquinone radical (QH) which is reduced to ubiquinol (QH2). In the Q cycle, QH2 donates electrons to cytochrome b and ISP, and protons to the intermebrane space, thus becoming Q. ISP sends its newfound electron to cytochrome c1 which gives it to cytochrome c, which was the point of this entire convoluted operation. Q is then is re-reduced to QH2 by another mechanism within the Q cycle.
Note: the fact that a proton gradient can later be used to drive ATP synthesis is referred to as “proton motive force” or “the chemiosmotic theory”.
Once the proton gradient is created, F1F0 ATP synthase (sometimes called Complex V) is responsible for harnessing it to create ATP. It has an F1 component (composed of α, β and γ subunits) facing into the matrix and an F0 component (composed of a, b and c subunits) embedded in the inner membrane. Each of the 12 c subunits of the F0 complex has an H+ binding site, and the cylinder of these units rotates 30° every time. The gamma subunit has only three possible positions, so it moves 120° once for every 4 protons. Each time it does this, it alters the conformation of the beta subunit.
ADP and Pi bind β in the loose (L) conformation. The γ rotation causes β to move to a tight (T) conformation, producing ATP. The γ then rotates another 120°, causing β to change to the open (O) conformation and releasing ATP. Thus you get 3 ATP per full turn
Uncouplers can allow the proton gradient to dissipate without producing ATP. This means that the energy of metabolism just gets dissipated as heat (e.g. via the uncoupling protein thermogenin, gene symbol = UCP1) rather than harnessed for ATP production. It’s an important mechanism for keeping body temperature up during hibernation in bears as well as in human infants (in brown adipose tissue). There are also small molecule uncouplers such as DNP, which was used as a diet pill for a few years.
Thermogenesis in infants and bears is regulated hormonally. The thermogenin channel is normally blocked open by ATP, ADP, GTP or GDP. Epinephrine signaling can turn on heat production. Epinephrine → GPCR → AC → cAMP → PKA → triacylglycerol lipase cleaves triacylglycerol into free fatty acids which will displace the nucleotides, blocking the channel open.
Brown fat was long believed to be unique to infants but has recently been shown to exist in adult mice and humans [reviewed in Lee 2013].
Both the ETC and ATP synthase are also popular targets for toxins. Rotenone inhibits Complex I (though then electrons can still enter the chain through succinate and start at Complex II), cyanide ions (CN-) inhibit Complex IV and the antibiotic oligomycin inhibits F0.
In the lab, the ETC can be studied in isolated mitochondria with O2 consumption as a marker of ETC progression. Adding ADP + Pi will allow the ETC to run very slowly; once you add succinate it really takes off. If you add CN-, it then stops. ATP is pretty much in lockstep with O2 consumption through all this.
If you add oligomycin to block ATP synthase, this actually stops the ETC even though ATP synthase is downstream of the ETC. This is because without ATP synthase to relieve the proton gradient, the gradient becomes so steep that the ETC can no longer fight it.
A few final notes on the co-regulation of glycolysis, CAC and ETC:
- When ATP consumption increases, the ATP/ADP ratio decreases and this results in increases in all of the processes’ activities. ADP activates PFK-1, increasing glycolysis. ADP activates regulatory enzymes in the CAC. And the ETC also increases for unexplained reasons.
- When ATP production increases, the ATP/ADP ratio increases and this inhibits all of the processes. ATP inhibits PFK-1, slowing glycolysis; ATP inhibits pyruvate dehydrogenase, slowing the CAC, and the ETC is also slowed.
- If the ETC or ATP synthase are inhibited, glycolysis speeds up to generate more ATP to compensate. But since the ETC is not running, NADH accumulates, increasing the NADH/NAD+ ratio. This slows down the CAC.

About Eric Vallabh Minikel
Eric Vallabh Minikel is on a lifelong quest to prevent prion disease. He is a scientist based at the Broad Institute of MIT and Harvard.