Proton NMR on recombinant PrP
Last month, Sonia and I produced our first batch of recombinant PrP here at the Broad Institute, and as a first QC step, we also performed circular dichroism (CD) on it. The CD spectrum told us that we had protein, and that it was largely alpha helical — both great pieces of news. With generous guidance from Mike Mesleh, an NMR expert here at the Broad, we also performed proton (1H) nuclear magnetic resonance (NMR) as another basic quality control technique on our protein, allowing us to check the purity, foldedness, and stability of our protein. This post will document what we learned from this NMR experience.
To review, we made full-length recombinant human prion protein (HuPrP23-230), and it came out at a concentration of 3.4 μM or 0.08 mg/mL. That concentration worked fine for CD, but NMR requires concentrations more on the order of 10 to 50 μM. So our first step was to concentrate our protein, which turns out quite simple: you just buy these tubes with a 5 kDa filter membrane, which allows your buffer but not your protein to flow through. First you spin some distilled water through the membrane to clear out any contaminants and preservatives. Then you load your sample in the top, and spin them at max speed in a tabletop centrifuge, checking on them periodically to see how much of the buffer has flowed through the membrane. You discard the flow-through and keep the more concentrated solution at the top. In this manner we reduced 1.5 mL of our original solution to just over 200 μL, theoretically increasing our protein concentration from 3.4 μM to something like 25 μM, though we’re told you tend to lose 5-10% of the protein (some of it sticks to the membrane), and we didn’t actually NanoDrop the concentration afterwards.
Next, you need the protein to be in 10% D2O, so you mix 180 μL of the concentrated protein solution with 20 μL from a bottle labeled “deuterium oxide” and you transfer the mixture to an NMR tube, which is a tall, narrow glass tube.
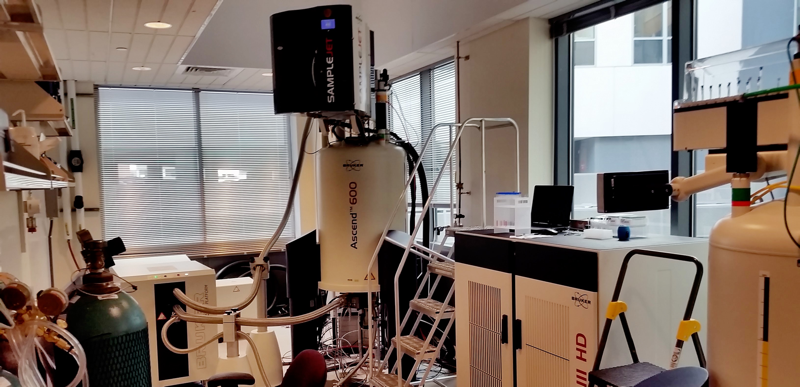
Then you’re ready to do NMR! At the Broad, this means loading the NMR tube into the NMR-coordinating robot and adding it to the queue of jobs to run. Actually generating the NMR spectrum only takes about 10 minutes, and on the day we did this, the queue was short, so we had results within an hour.
Now, there are lots of different types of NMR, depending on what atom(s) are being observed. In our case, we had unlabeled protein, and we simply did 1H, or proton, NMR. This means that every hydrogen atom in that NMR tube is being observed and is giving off its own particular chemical shift depending on the environment that it is in. Now, 90% of the water in that tube is also just regular H2O, so those hydrogens are being observed too — but the software has a method to just subtract out the signal from that water. Our sample, as we were about to find out, also had a fair amount of imidazole and possibly Tris left over from the elution buffer, so the hydrogens in those small molecules were being observed too. But mostly, what you see is the hydrogens in the protein, and each one’s chemical shift tells you something about where in the protein it is.
For very short proteins — say, 50 or maybe even 100 amino acids — proton NMR can actually give you sufficiently high-resolution information to allow you to solve the protein’s structure. For slightly larger proteins, like our HuPrP23-230, which is 208 amino acids, you usually need an isotopic label such as 15N in order to get sufficient data to determine a structure. The first solution NMR structures of mouse PrP and human PrP from Kurt Wuthrich’s lab, for instance, both relied on 15N labeling [Riek 1996, Zahn 2000]. For yet larger proteins still, there exist fancier tricks, such as using both 13C and 15N labels at once. In any case, for PrP, we weren’t going to be able to reconstruct the whole high-resolution structure from just 1H NMR. Instead, the goal was simply to get enough data to check for any major contaminants, determine whether the protein was folded, and see whether it stays folded if left at room temperature for a few days.
We got back an NMR spectrum, and Mike sat down and walked us through what each peak meant. I have some notes on general principles of how NMR works, and how to interpret 1H NMR chemical shifts, from organic chemistry 31, especially this handout from that class. Basically, hydrogens give a very different signal on NMR depending on what atom or group they’re bound to, and then they have more subtle shifts depending on what lies further afield of their immediate neighbor. The x axis is chemical shift in parts per million, with (by convention) smaller values plotted to the right (“upfield”) and larger values plotted to the left (“downfield”). Here is what our spectrum looked like, with annotations for what Mike told us each peak probably represents:
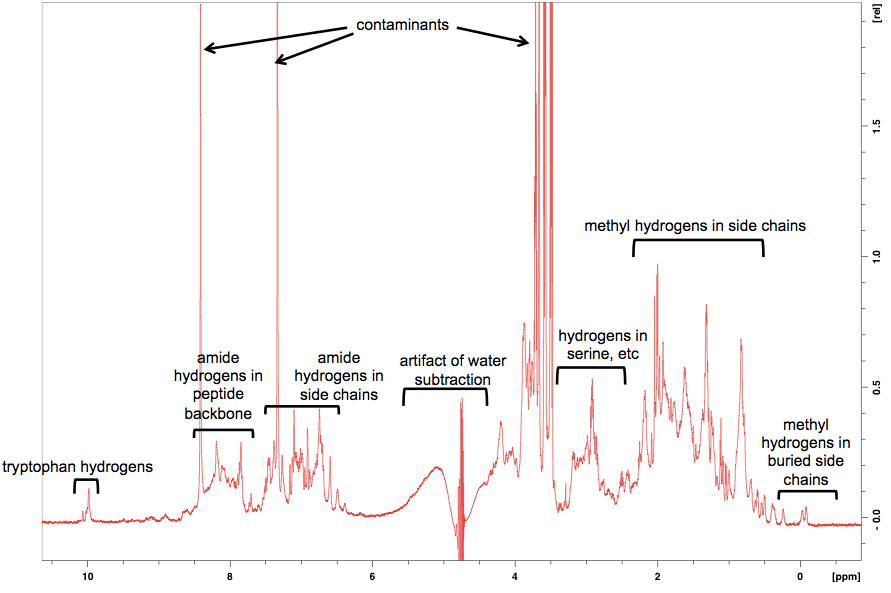
As you can see, the first thing that jumps out at you visually is actually the least interesting: the large peaks corresponding to small molecule contaminants. We think that these are probably Tris and/or imidazole, whose structures are as follows:
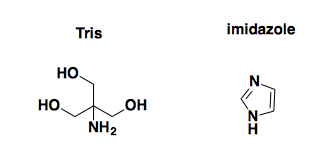
Why are these contaminants here? On reflection, we realized that our elution buffer deliberately contains 10 mM Tris and 500 mM imidazole. We dialyzed the ~100 mL of protein solution we made in a total of just over 10 L of dialysis buffer to try to remove them. But that’s only a 100-fold dilution, so we would still expect 5 mM imidazole and 100 μM Tris in the solution in that NMR tube, both much higher concentrations than our protein, which is only about 25 μM after concentrating it. D’oh. Luckily, though, there are only a few peaks here, so you can just make up your mind to look past them, at the smaller but more interesting protein peaks below.
I’ve highlighted two areas that were interesting enough to zoom in on. The hydrogens in the two-ring system of the tryptophan side chains have a uniquely downfield chemical shift (far left). But you can also see the way that their chemical shift is influenced by the local environment around each tryptophan.
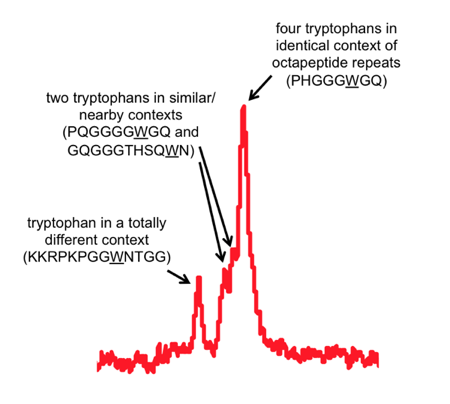
One peak seems to represent a pileup of several equivalent tryptophans. Those must be PrP’s octapeptide repeat tryptophans. Then just to the left of the main peak are two smaller sub-peaks, which must represent two tryptophans that are nearly, but not quite, chemically equivalent to the other 4. I figure those must be the tryptophans immediately on either side of the octapeptide repeat region. And finally, there’s a tryptophan in a very different chemical environment, all out on its own to the left, so that must be the most N-terminal tryptophan, W31.
Then the other area Mike was keen to zoom in on is the side chain methyl hydrogens at far right:
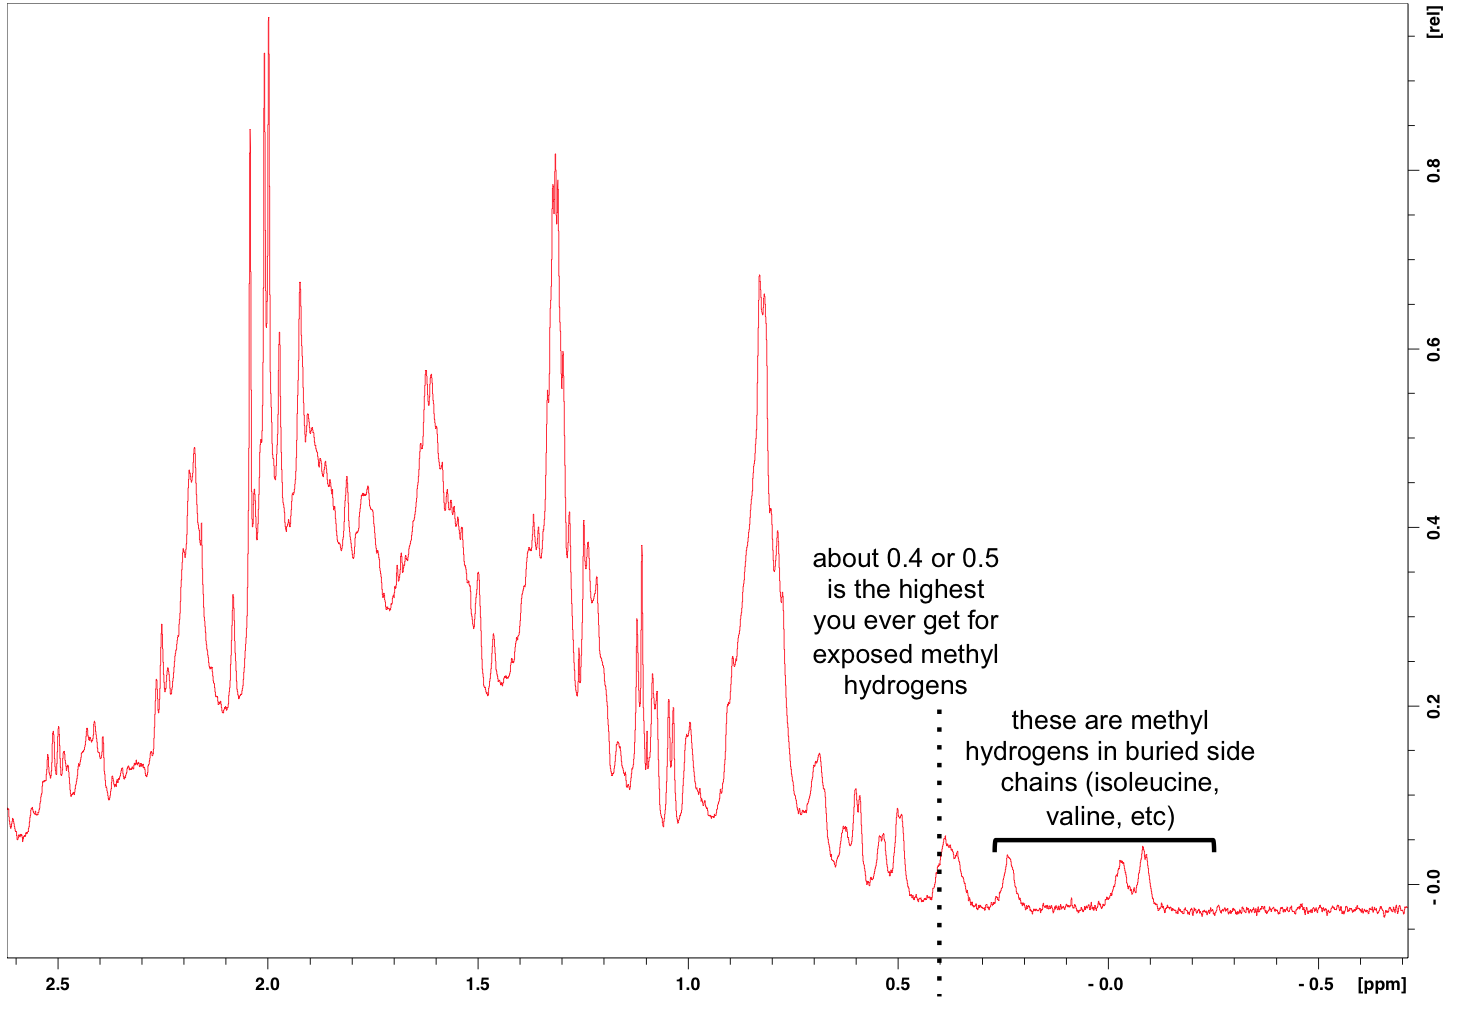
The chemical shifts of methyl hydrogens in solvent-exposed side chains are numerous and overlapping, hence the larger peaks at left. But what’s interesting about these is the small peaks at far right. Apparently exposed methyl side chains never yield chemical shifts upfield of about 0.5 or 0.4. So the fact that we see chemical shifts further to the right can only be explained by those side chains being buried inside a folded protein. So those little peaks at the far right represent the best piece of news from this 1H NMR spectrum: we have a folded protein.
Because the NMR is all automated here, we learned that it is also easy enough to queue up additional readings of the sample. This way, the protein can sit at room temperature inside the robot for days and then be scanned again, and you can learn how stable your protein is at room temperature — a useful thing to know if you plan on doing any assays where the protein is liable to end up sitting around for a few days in a queue or in a long experiment. Here is what the 1H NMR spectrum of our protein looked like in time series:
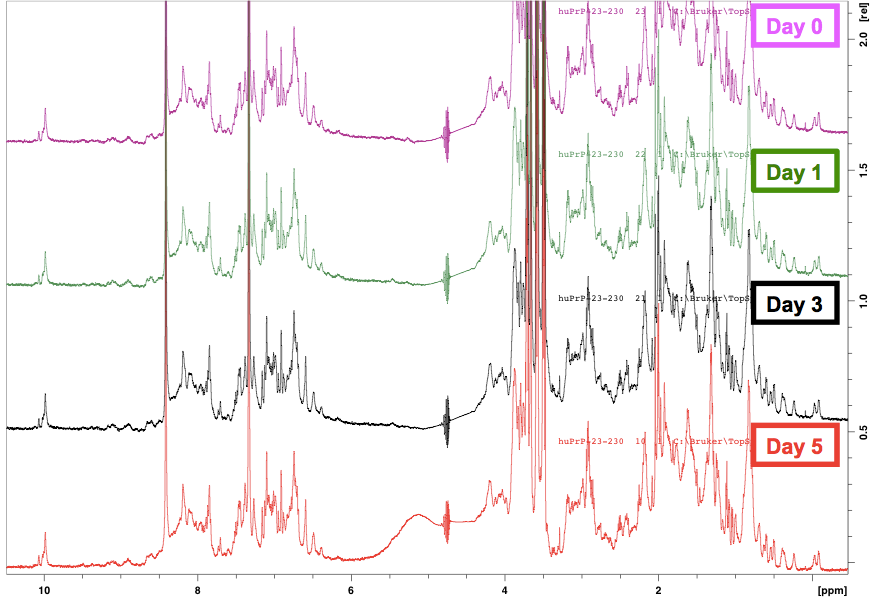
The spectra are virtually indistinguishable, meaning that our protein was extremely stable over 5 days at room temperature. That makes sense, because after all, in RT-QuIC, HuPrP23-230 is quite a stable substrate, taking days to sponteneously convert to amyloid even when heated and shaken at high speeds in the presence of detergent.
So, all good news on the NMR front — it was exciting to begin learning this technique, and good to see that the protein we produced appears to be folded and stable.

About Eric Vallabh Minikel
Eric Vallabh Minikel is on a lifelong quest to prevent prion disease. He is a scientist based at the Broad Institute of MIT and Harvard.