How to do a GWAS for heterozygote advantage
Heterozygote advantage is when the heterozygous genotype has a better phenotype than either homozygous genotype. Perhaps the most famous example is rs334, the E7V mutation in HBB that causes sickle-cell anemia. If you’re homozygous VV then you have sickle cell anemia (that’s bad), if you’re homozygous EE then you’re vulnerable to malaria (also bad), but if you’re heterozygous EV you’re off the hook for both.
Most genome-wide association studies I read don’t even bother to check for heterozygote advantage – they only run additive (allelic) models and dominant models. This issue is dear to my heart, though, since some coding SNPs in the prion protein gene PRNP exhibit heterozygote advantage, having a dominant negative effect that slows or prevents the autocatalytic spread of prions. The most common of these is rs1799990, the codon 129 M/V polymorphism [reviewed in Lukic & Mead 2011]. The other accepted examples in PRNP are rs1800014 E219K [Shibuya 1998] and G127V, which is not in dbSNP [Mead 2009 (ft)]).
PLINK [Purcell 2007] has options to run additive (allelic) and dominant models of genotype/phenotype association. However it does not have an option to compare the heterozygous genotype against both homozygous genotypes. The closest thing PLINK offers is --model, which compares all three possible genotypes for each biallelic marker: DD vs. Dd vs. dd. This option will pick up heterozygote advantage, but has the following limitations:
- Not compatible with quantitative phenotypes
- Not compatible with quantitative covariates e.g. population principal components (
ERROR: Cannot specify --covar with --model) - No trivial way to scan results to see which associations were driven by Dd > DD,Dd.
So instead, I figured out a way to trick PLINK into doing what I want. My idea was to change both homozygous genotypes to be the same, so that when you ask PLINK to run an allelic model (say, with --linear) it will unwittingly do a heterozygous vs. homozygous comparison. Here’s what I came up with:
cat gwas.ped | awk '{printf $1" "$2" "$3" "$4" "$5" "$6; for(i=7;i<6+142780*2;i=i+2) { j=i+1; if($i==$j) {printf " C C";} else {printf " C T";}} print""}' > het.ped
*Thanks to this Stackoverflow discussion which was crucial in helping me figure out how to do this with awk.
Here’s what that code does in plain language: for each line, print the first 6 columns (the mandatory .ped columns) and then starting with column 7 and going up to column 6+142780*2 (where 142780 = number of SNPs in your dataset, wc -l gwas.map if you’re not sure), look at every pair of columns, and if they’re the same (e.g. A A or G G) recode them as C C, and if they’re different (e.g. A G) recode them as C T. printf makes sure the output stays on the same line for the whole loop, then once the loop is over, print"" ends the line. You don’t need to change the .map file at all. You’re ready to roll, just specify different ped and map filenames for PLINK:
plink --ped het.ped --map gwas.map --pheno quantitative.phe --covar quantitative.covars --linear --adjust --out heterozygote.advantage.analysis
Needless to say, you lose the option to do any filtering based on Hardy-Weinberg equilibrium with --hwe. But if you need to, you can always filter your SNPs before you do this little trick.
And that’s that. If you’re lucky maybe you’ll find a really strong association, like this:
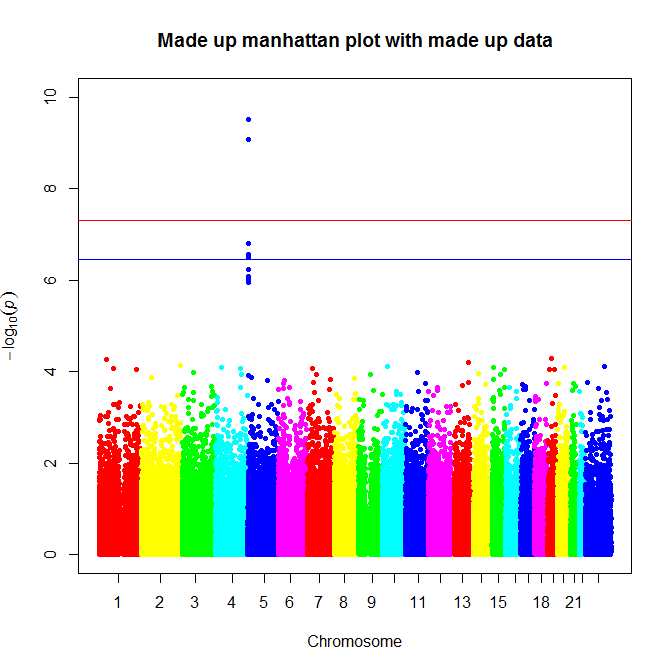
Graphic created using a lightly modified version of Stephen Turner’s Manhattan plot code.

About Eric Vallabh Minikel
Eric Vallabh Minikel is on a lifelong quest to prevent prion disease. He is a scientist based at the Broad Institute of MIT and Harvard.