How to explain the discrepancy in PrPC half-life estimates in vivo
To date, only two studies have sought to estimate the half-life of PrPC in the brain in vivo [Safar 2005 (ft), Price 2010]. They came up with very different estimates: 18 hours and 4.95 days respectively. The purpose of this post is to discuss possible explanations for this difference.
If you don’t read the whole post, the take-home message is: alpha and beta cleavage, conformational change and PrP binding to other ligands could all potentially contribute, but some of these things are pretty hypothetical and I’m not sure they could add up to a full explanation for this large difference in measurements.
I’ll begin with a comparison of the methods.
Safar’s methods
Safar 2005 (ft) created mice expressing PrP under the control of a Tet-off switch and treated them with doxycycline to suppress PrP expression, then serially sacrified groups of 3-5 of them to see how the concentration of PrPC decreased over time after doxycycline administration [Fig 2]. Although these mice were not infected with prions, Safar used CDI [Safar 1998] (normally a tool for looking at misfolded conformations of PrP) to assess the concentration of PrPC. According to Safar’s methods, CDI was performed using recFab D13 [Peretz 1997] as the “antibody” (Fabs are recombinant antibody fragments). recFab D13 is used based on the observation that it binds little to PrP 27-30 (PK-digested PrPSc) but binds more strongly to GdnHCl-denatured PrP 27-30, thus making it an indicator of PrP’s conformation [Peretz 1997]. Peretz states that the D13 Fab “showed a pattern of immunoreactivity with native and denatured PrP 27-30 similar to that found for the 3F4 Fab, which binds to PrP residues 109 to 112″ and that it “reacted with peptides corresponding to residues 95 to 104″. Together these statements indicate that D13′s binding site lies within PrP codons 95-104 and that it is not (very) accessible in a PrPSc conformation. Safar’s data show an exponential decay of PrPC as quantified by D13 binding in CDI [Fig 2], with an estimated half-life of 18h.
Price’s methods
Price 2010 fed mice a diet consisting exclusively of 15N radiolabeled algae, sacrificed them at intervals after the diet began and performed mass spectrometry-based proteomics to quantify the accumulation of radiolabeled proteins in the brain. Based on nine timepoints (0 days,0.38 days, 1 day, 2 days, 4 days, 8 days, 16 days, 24 days and 32 days after the diet began) Price calculated a turnover rate for each protein, kturnover, which can be interpreted as the rate (λ) of an exponential growth curve, thus (assuming the total protein level is at equilibrium) the half-life of the protein is ln(2)/kturnover. According to [Supplementary Dataset], just one PrP peptide was successfully quantified in the proteomics analysis, which was “VVEQMC(Carbamidomethyl)VTQYQK”. This corresponds to codons 209-220 (inclusive) in human PrP, very close to the C terminus (the post-translationally modified protein ends at codon 231). This peptide gave a kturnover of .14, thus a half-life of ln(2)/.14 = 4.95 days.
discussion of differences
One explanation that might contribute to the discrepancy is alpha and beta cleavage. The diagram below compares the alpha and beta cleavage sites in mouse PrP to the D13 epitope:
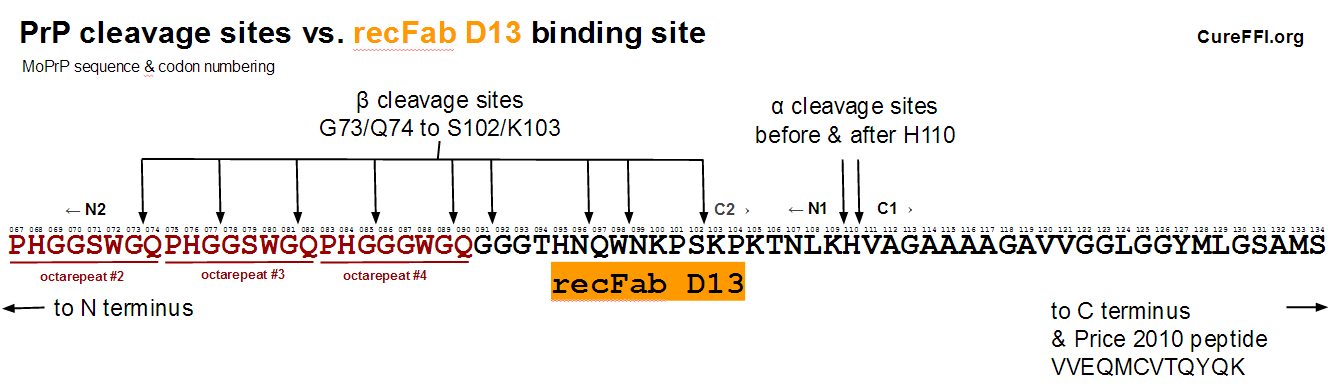
Alpha cleavage would leave the D13 epitope intact but situated in the N1 fragment shed from the cell surface. As far as I can tell, not much is known about the subsequent degradation of the N1 fragment. I looked at a few relevant papers [Harris 1993 (ft), Guillot-Sester 2009, Fluharty 2013] and didn’t see any information. Alpha cleavage occurs in a considerable fraction of PrPC molecules – in a quick roundup of literature, [Westergard 2011] cites a range of 10-50%. So if N1 is degraded quickly but C1 is more durable, this could go some of the way towards explaining the difference between Safar’s figure and Price’s figure. But I don’t have any citations to actually claim a difference in degradation rates between these two fragments.
A second observation is that 3 of the 9 beta cleavage sites depicted above would abolish the D13 epitope. (Note: The cleavage sites depicted above are actually mouse equivalents of known HuPrP cleavage sites from [Parchi 2000, Table 1], see this post; I didn’t find any data on beta cleavage sites specifically in MoPrP). This means that beta cleavage of PrP could also potentially have contributed to the difference between Safar’s and Price’s figures. However, this is unlikely to be a very large contributor as beta-cleaved PrP is said to account for only a few percent of total PrP in uninfected brains [Chen 1995 (ft)].
Together, both of these phenomena could potentially point in the right direction. If you suppose that maybe C1 is more durable than N1, then this would tend to explain why Safar’s number is artificially low and Price’s artificially high. But neither alpha nor beta cleavage seems large enough in magnitude to fully account for the large discrepancy.
Another potential explanation is that PrPC exists in a variety of conformations, with 5-25% of PrP molecules being what Wenquan Zou calls ”silent prions” [Yuan 2006 (ft)]. These conformations have some biochemical properties of PrPSc, such as detergent insolubility and NaPTA precipitation. Whether they might also exhibit reduced binding to D13 has not, to my knowledge, been reported. Perhaps these more aggregated species of PrP are the ones that stick around longer, thus contributing to Price’s number, yet don’t contribute much to Safar’s due to reduced D13 affinity.
Now, as mentioned above, I am assuming that the overall protein level is at equilibrium and so the rate of production of PrPC equals the rate of degradation. That’s why in the previous paragraph I referred to aggregated species that take a long time to degrade still “contributing to Price’s number” when in fact Price’s number is based on PrPC translation (radioisotope incorporation) rather than degradation.
Which is an interesting point when you think about it. Any and all varieties of PrP, regardless of conformation, cleavage state, etc., will contribute to the PrP quantified by Price, provided only that they include the intact VVEQMCVTQYQK peptide, which as far as I know has never been reported to be destroyed in any cleavage event and which will still be detected by mass spec regardless of PrP’s conformation.
In contrast, Safar’s measurement requires that PrP be intact (or, at a minimum, at least the N1 fragment be intact), and that the D13 epitope be exposed. Conformational change can bury this epitope. Could PrP binding events also occlude D13 from binding PrP?
For instance, amyloid beta (Aβ) binds PrP at PrP amino acids 95-110, as discovered through experiments with PrP deletion mutants [Lauren 2009] and confirmed through experiments with 6D11, another antibody to this site [Um 2012, Larson 2012, Um 2013]. Aβ binds PrP with a Kd of 0.4 nM [Lauren 2009] while full-length D13 antibody binds with a Kd of 3.3 nM [Peretz 2001 - Supp Table 1]. So apparently amyloid beta actually has stronger affinity for PrP than does D13, and it binds at the same site. Could some of the decrease in PrPC in Safar’s measurement be due to occlusion of a higher and higher fraction of the remaining PrP molecules by Aβ? Or, for that matter, by other ligands?
summary
In sum, I can think of three possible reasons to explain the difference between these two estimates:
- Proteolytic cleavage. Beta cleavage would abolish the D13 epitope measured by Safar. Alpha cleavage would send Safar’s D13 epitope floating away on the N1 fragment and Price’s PrP peptide still anchored in the C1 fragment. If the N1 fragment is quickly degraded and the C1 fragment is durable, that would mean Safar’s measurement is deflated and Price’s measurement is inflated. Which measurement is more “correct” would depend on what species of PrP you’re interested in measuring. Because C1 appears incapable of becoming a prion [Westergard 2011], for prion disease modeling purposes perhaps the half life of non-alpha-cleaved PrP is the more relevant figure.
- Conformational change. Even in uninfected brains, some fraction of PrPC has some PrPSc-like character; perhaps this PrPSc-like PrPC is relatively longer-lived, yet it had the D13 epitope buried and so was not measured by Safar’s assay.
- Occlusion by other ligands. At least one ligand – amyloid beta – can bind the D13 epitope with greater affinity than D13 itself. Perhaps this or other ligands occluded a higher and higher fraction of the remaining PrPC after PrP transcription was shut off with doxycycline in Safar’s study, contributing to an appearance of faster PrP degradation than was really the case.
Other than the (purely hypothetical) high half-life of the C1 fragment, I haven’t yet managed to come up with any other specific explanations for why Price’s figure might be inflated. Of course, having worked with some mass spec proteomics data myself, I know it’s far from perfect. But on the other hand, radioisotope incorporation has been around a long time and seems to be a tried-and-true method for determining protein turnover rates [reviewed in Toyama & Hetzer 2013].
So that’s all I’ve got so far. Are any of these ideas totally off base? Are there any other good explanations for the vast discrepancy between 18 hours and 4.95 days? I welcome any comments.

About Eric Vallabh Minikel
Eric Vallabh Minikel is on a lifelong quest to prevent prion disease. He is a scientist based at the Broad Institute of MIT and Harvard.