Differential scanning fluorimetry for PrP: an assay development saga
Sonia and I would like to find small molecules that bind the prion protein (PrP). The hope is that such molecules could be therapeutic, by either stabilizing PrP against misfolding, preventing prions from binding PrP, or maybe by targeting PrP for degradation. A first step would be to just find any chemical matter that binds PrP. So here’s the story of an effort that Sonia, myself, and our MIT intern Rishi Shah, undertook on and off over the course of several months, to try to develop a high throughput thermal shift assay for PrP.
Differential scanning fluorimetry (DSF) is a fluorescence-based assay for finding compounds that change the melting temperature (Tm) of a protein. For a good review and introduction, see [Niesen 2007]. Basically, the assay principle is this. You combine your purified recombinant protein with a hydrophobic dye in solution. The dye has some amount of intrinsic fluorescence, but its fluorescence greatly increases when it binds to hydrophobic patches on a protein. Most proteins when properly folded have their hydrophobic parts hidden — indeed, it’s thought to be the entropy gains from releasing “caged water” around these parts that drives protein folding in the first place — so these hydrophobic surfaces are only exposed when the protein melts, meaning, when it unfolds, loses its structure. Thus, as you gradually heat the protein from (say) 25°C to 95°C, at some point you see an increase in fluorescence, and from this you can infer the melting point of your protein.
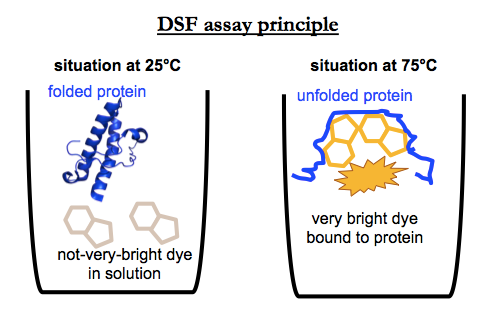
If you add a compound that binds and thermally stabilizes the protein, you should see a shift in that melting point. Thus, by screening thousands of compounds and quantifying the melting point, you can find a binder of your protein of interest. One reason why DSF is often a preferred method for target-based screening is that it is eminently scalable. It can be done in 384-well plates and even smaller scales, often with as little as 10 μL of a 1 μM protein solution per well. One liter of bacterial culture could yield enough protein to screen tens of thousands of compounds.
Here’s what the assay setup looked like in our hands. We used recombinant PrP purified by this method, focusing on HuPrP23-230 and HuPrP90-231. We used SYPRO® Orange dye, which is a proprietary dye with this structure:
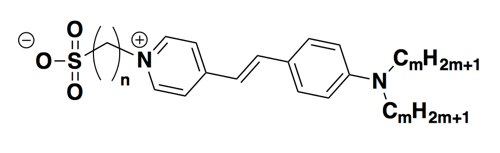
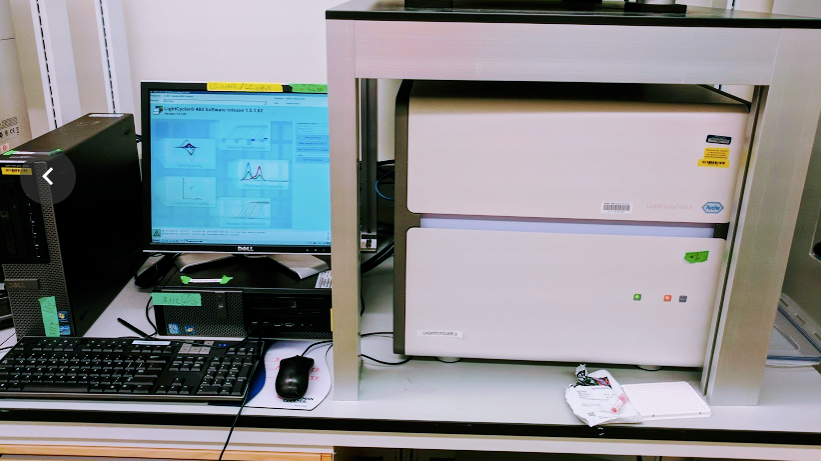
The manufacturer doesn’t disclose the true concentration in terms of molarity. Instead, the concentrations are given in terms of “X”, i.e. the dye is purchased as a 5,000X concentrate which can be diluted to, say, 1X or 5X or 10X for the assay. We used Roche Lightcycler 480 II instruments and their corresponding plates. Here’s the setup:
With that background, here’s the story of our efforts to develop a DSF assay for PrP.
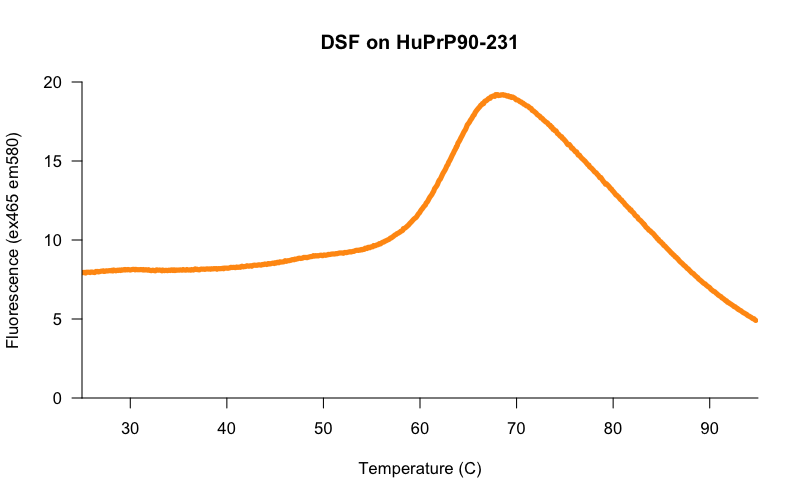
Early on, a colleague who was training us how to use the lightcyclers suggested that we begin by trying a range of protein concentrations from, say, 0.1 mg/mL to 0.5 mg/mL. We did so, and lo and behold, the higher the protein concentration, the cleaner and more reproducible the melting curves were. In the initial search for good conditions, we pushed the protein concentration even higher, and found that at 0.8 mg/mL we got beautiful curves — here is one example, from HuPrP90-231 in 20 mM HEPES, 25 mM NaCl, 1 mM EDTA at 50 μM in 10 μL final volume, melted in a 384-well white lightcycler plate in a Roche Lightcycler 480 on the protein melt program, with 10X Sypro Orange dye and 2% DMSO:
The curves at this concentration looked smooth and reasonably consistent between wells, so using these conditions, we set out to determine the Z’ [Zhang 1999] of our assay — a measure of the separation between negative control and positive control wells, and thus of the statistical power of the assay to detect true novel hits. We tested 30 replicates each of DMSO-only and FeTMPyP, a reported positive control for PrP [Caughey 1998, Nicoll 2010, Gupta 2016, Massignan 2016] and compared the distributions of their melting temperatures, called using a 4-point dose-response curve fit with the R drc package. Here’s what we got:
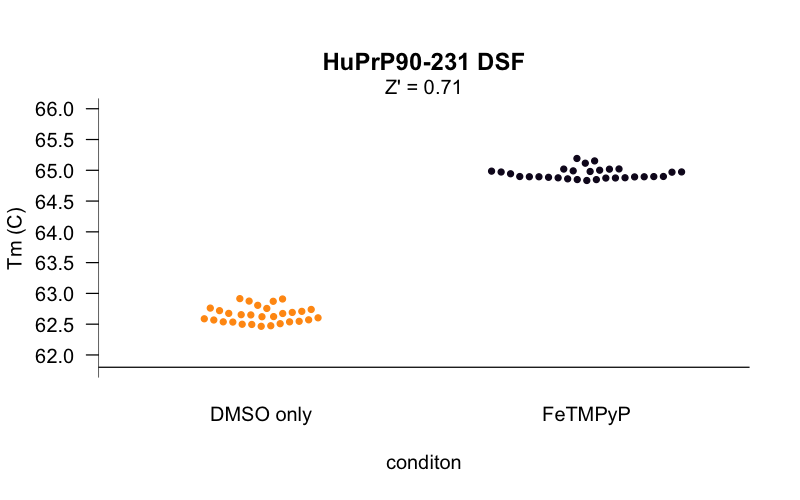
The Z’ was 0.71, within the range considered to be an “excellent” assay. For a minute it seemed like we were almost ready to start screening. But there was a catch. PrP is a small protein, so seemingly innocent mg/mL values correspond to huge concentrations in molar terms. The HuPrP90-231 construct used here weighs in at just 16 kDa, so the 0.8 mg/mL in the experiments above is actually about 50 μM protein. That’s a problem because in order to see a shift in a protein’s melting curve, you need to saturate most of the protein with ligand. An assay that requires 50 μM protein might be usable if your goal was, say, to screen for different buffer conditions that promote PrP stability, or maybe if you wanted to screen a compound deck of ultra-soluble fragments at, say, 1 mM. But we wanted to screen a deck of small molecules more in the 350-550 Da molecular weight range, where one doesn’t expect most compounds to be soluble above 10 μM in aqueous solution in 2% DMSO. The protocol I cited earlier [Niesen 2007] recommends that for small molecule screening, one wants a 10:1 ratio of ligand to protein to drive the interaction and saturate the protein, and that 10 μM small molecule and 1 μM protein is a good starting point. We were off by 50-fold. (As argued here, I’ve come to think that it’s hazardous to even speak of protein concentration in mg/mL terms when what you’re talking about is a binding assay. I assume the reason people do still talk this way is that the dyes used in DSF bind to hydrophobic patches generally, rather than proteins in a 1:1 manner, so mg/mL may actually better reflect the amount of protein needed to get a good signal.)
The core challenge was to get the assay working with a protein concentration more amenable to screening. When we scaled back the protein concentration, the results looked much less promising. Here, for example, is a melt curve for 5 μM HuPrP23-230:
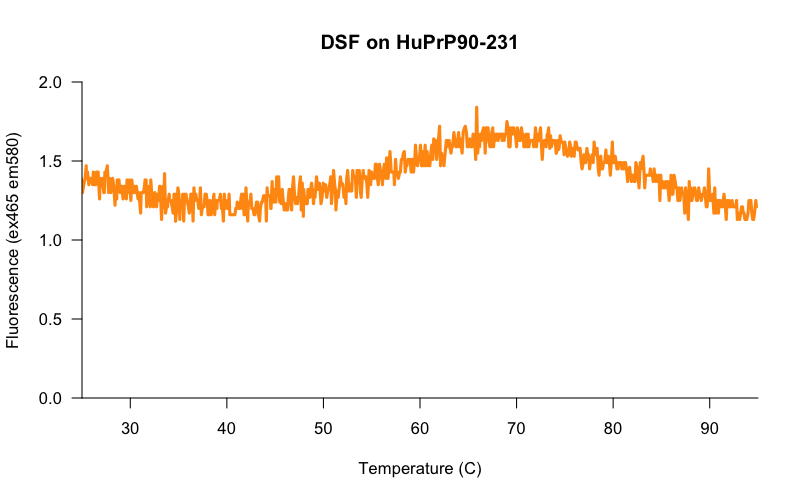
The signal to baseline (S:B) ratio is terrible — the highest point on the curve (~1.7) is only about 1.4x higher than the baseline (~1.2). And you can see from the jaggedness of the curve that we’re really scraping the bottom of the instrument’s lower limit of quantification. I tried various computational ways of dealing with this jaggedness, such as smoothing out the curve with a 1D Gaussian filter, but no matter what I did, the Tm varied dramatically from one well to the next. And even 5 μM, mind you, is a higher protein concentration than we’d ideally like to use. If we had 5 μM protein and 10 μM small molecules in a screen, then per these calculations a hypothetical 5 μM Kd binder would only put 58% of the protein in a bound state, not necessarily enough to be called as a hit. So even if we could get 5 μM protein to work as a screening concentration, we’d still only be powered to detect very strong binders.
Indeed, once we realized that our original curve had been with 50 μM protein, it became apparent that our positive control results didn’t even make any sense. That curve up top was obtained with 50 μM protein and only 20 μM of our positive control, FeTMPyP. If the Kd is ~20 μM (as we’ve estimated by ITC), then only about 20% of the protein should be bound to the ligand at these concentrations, presumably not enough to shift the melting curve by 2.5°C. So this “positive control” shouldn’t have worked! Yet it did. Examination of the raw melt curves from the above beeswarm plot revealed that FeTMPyP lowered the overall fluorescence by quite a bit:
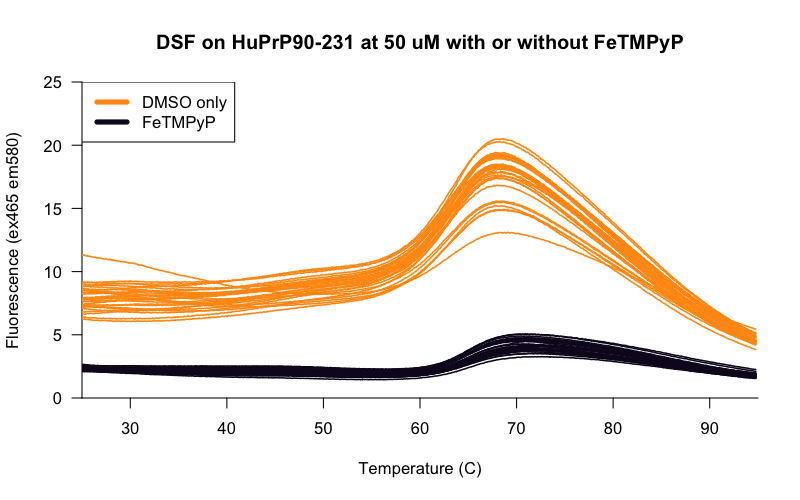
It may well be the case that the temperature “shift” we saw was somehow just an artifact of FeTMPyP’s interference with the fluorescence of the assay, and FeTMPyP wasn’t a real positive control in this case.
There is one published paper that we’re aware of that used DSF on PrP [Poncet-Montange 2011], and nominally their Z’ values were pretty good (~0.5 - 0.9) but they hadn’t really solved the problems we were struggling with here either. The conditions they ultimately settled on and used for a small screen (2,160 drugs and natural products) were 10 μM protein, 100 μM compound, and a 150 μL reaction volume (in 96-well plates). So they maintained the recommended 10:1 protein:ligand ratio only by pushing the compound concentration very high. It is not clear how many of the compounds in their library were actually soluble at 100 μM, and in any case, most of the compounds we wanted to screen were not soluble at such a high concentration. And the good Z’ values in that paper were calculated using 200 mM trimethylamine N-oxide (TMAO or TMANO) as a positive control. TMAO apparently acts as sort of a universal positive control, increasing the melting temperature of almost any protein, presumably by some sort of solvent effect on the energetics of protein folding, not by actually binding the protein. So the +3°C change in Tm that gave rise to those good Z’ values may not actually be any sort of predictor of what magnitude of effect a true small molecule binder would have on PrP’s melting temperature. As a final consideration, the 150 μL reaction volume used in that study wouldn’t be scalable to the format (384-well) and scale (10^4 - 10^5 compounds) that we wanted for our screen.
Having failed to find an answer in the literature, we set out to vary all the different parameters of the assay to see if there was a combination that would give us a sufficiently reproducible Tm as to be worth scaling for a screen. And at this point, we decided to stop using Z’ as our metric of assay quality. We reasoned that the melting temperature shift given by millimolar concentrations of TMAO, or a fluorescence artifact of FeTMPyP, may be no predictor at all of the melting temperature shift that you might get from a real binder. Therefore, for a protein like PrP with no true small molecule binder to the structured domain, we decided it’s reasonable to just focus on minimizing the variance in Tm among DMSO-only wells, thus maximizing power to detect small Tm shifts from hypothetical hits, without worrying too much about the Z’ per se.
In an effort to get the Tm variance down, we tried keeping protein at 5 μM or so but varying all the other properties of the assay: total volume, dye concentration, buffer, metals, and protein construct. Spoiler alert: nothing worked.
Increasing the assay volume seemed like a promising route, because a high assay volume had been reported to work well in [Poncet-Montange 2011], and because intuitively, the fluorescence ought to be proportional to the total amount of protein in the well, rather than the concentration of protein. But no dice. Here’s assay volume versus the standard deviation of melting temperature or SD(Tm):
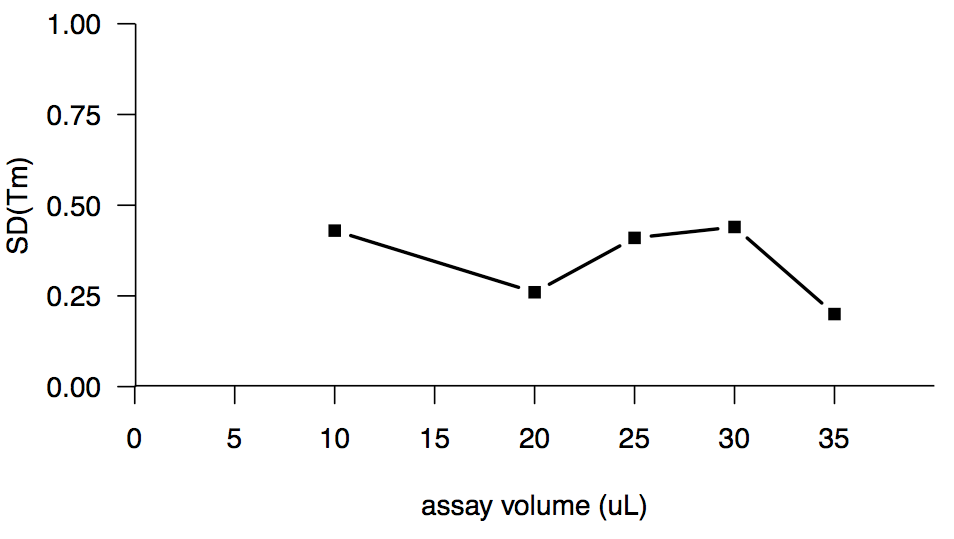
The wells in the 384-well lightcycler plates are only 40 μL in volume, so we couldn’t go any higher.
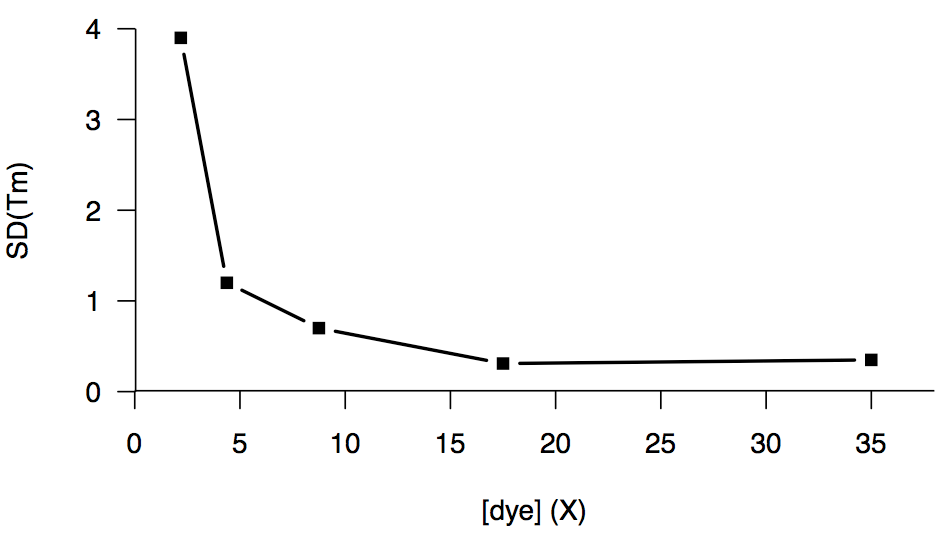
We also tried increasing the dye concentration, which helped up to a point, but the returns diminished past about 15X, and we couldn’t get below a floor of an SD of about 0.3°C:
We did one experiment comparing HuPrP23-230 in a HEPES buffer versus one batch in phosphate buffer, and we briefly got excited when the phosphate buffer gave us a nominally lower SD (0.12°C), than the HEPES (0.46°C), but this proved to be merely a fluke — later experiments with PrP in phosphate buffer gave us an SD of 0.3°C or higher, just like we’d been seeing all along.
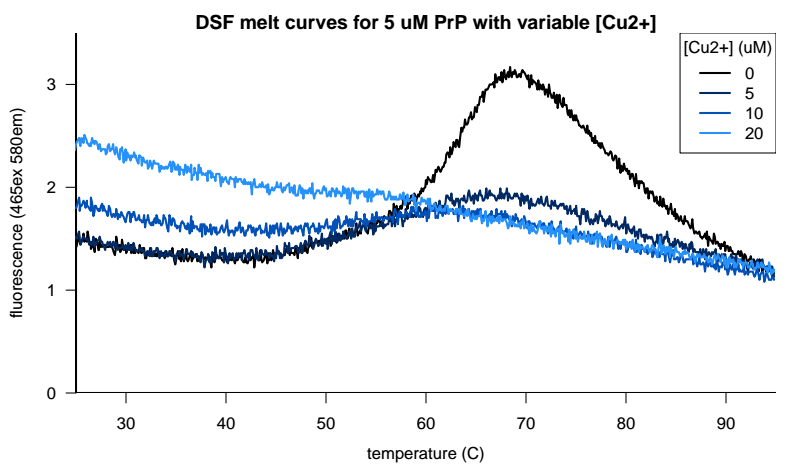
After a holler from Glenn Millhauser on Twitter we also decided to see if copper or zinc would give us better results. After all, these metals are reported to modulate how PrP’s N terminus folds and docks on the face of the C terminus [Spevacek 2013], and it might be more physiologically relevant to screen metallated PrP anyway. But copper, it turns out, quenches the fluorescence of Sypro Orange. When we added 1 equivalent of copper to our PrP, we got a much weaker melting curve, and when we added 4 equivalents, we got no melting curve at all:
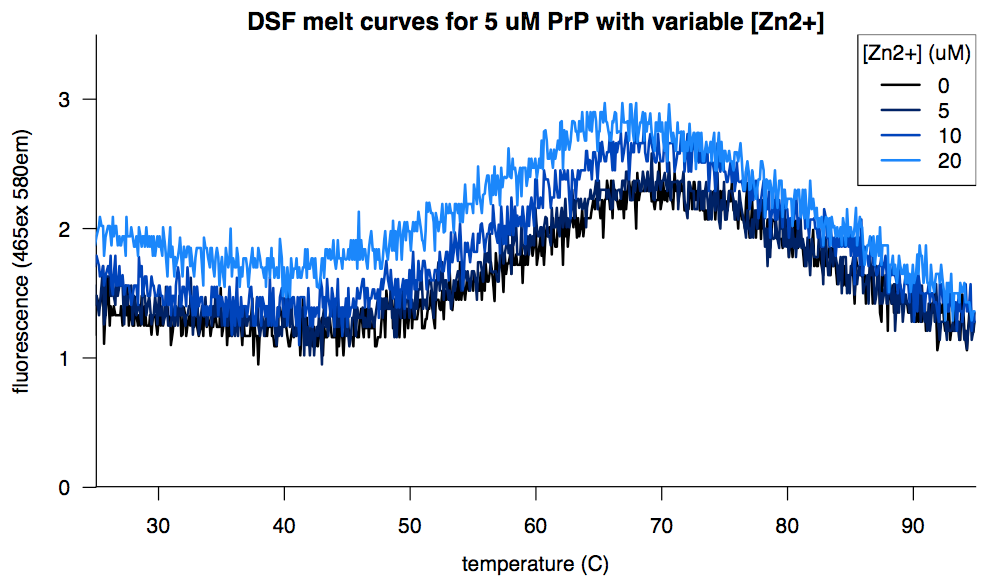
Zinc, in contrast, was tolerated but didn’t help any:
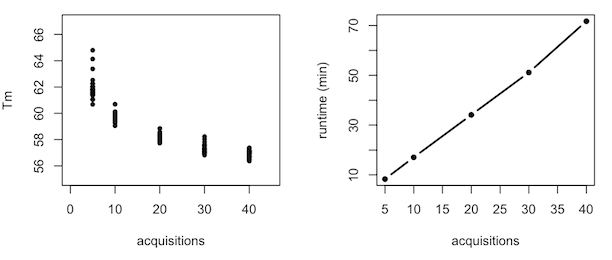
For all the experimental variables that failed to impact the distribution of melting temperatures, one unwanted and unexpected variable did prove to matter: the runtime of the melt curve. The “protein melt” program on the lightcyclers was nominally scheduled to take about 25 minutes to ramp from 25°C to 95°C, but in practice it took anywhere from 6 to 28 minutes, with no apparent rhyme or reason. We were told this was a software bug with no known fix. The shorter runs, meaning the more rapid heat ramps, tended to give us more variability in melting temperature within the same plate. That kind of makes sense because a more rapid heat ramp might create more opportunity for edge effects and so on. To prove to myself that this was the case, I ran five experiments identical except for the number of data acquisitions per minute (which allows the user to indirectly specify the runtime, though this unfortunately doesn’t override whatever bug is at work):
But through all these experiments, the best distribution we could ever reliably get was an SD of about 0.3 °C. And that’s just not good enough. The 68-95-99.7 rule means that if our SD was 0.3°C, then out of 1000 compounds we would hypothetically screen, 997 of them would fall within a 1.8°C range. This would mean that even if we were willing to tolerate a 0.15% false discovery rate and call everything above this range a hit, there was still no guarantee that a compound giving a true 1.5°C Tm shift would even be called as a hit. And all this was with manual plate loading, whereas whenever we tried to load plates in a scalable way, with an electronic multichannel or a CombiNano, we got even more variability.
The core problem, we realized, was that we simply had very little signal to work with. The DSF protocol I mentioned earlier [Niesen 2007] gives the example of a ~500% increase in Sypro Orange fluorescence upon melting a protein, i.e. an S:B ratio of 5. Our S:B ratio at any remotely realistic protein concentration was only about 1.4. A colleague at Broad who had done a few DSF screens said you really need an S:B of about 5, and a SD of Tm down around 0.1 °C, before it’s worth screening. Niesen suggests that different dyes work for different proteins and that it’s worth experimenting with other dyes. But it turns out that the other dyes mentioned in that paper, such as 1,8-ANS, have excitation and emission wavelengths that are not compatible with the Roche lightcyclers, which are hardwired to do only a few wavelengths — you can’t even buy your own filter and put it in there, or at least not without a lot of hacking. I wrote to Roche to ask whether there was some way around this constraint, or anything else I should try. A helpful Tech Service representative got back to me, and after exchanging a few emails about our experimental details amd what we’d tried so far, I said it sounded like DSF for our protein was not worth pursuing further, and the representative replied: “Unfortunately, I would agree with your conclusion.”
Is DSF for PrP a dead end? I’m not sure. As often happens in science, we never got to the point of definitively proving to ourselves that DSF could never work. We tried a large battery of different conditions, failed to find any that worked, and gradually the prospects for success came to seem remote enough that the project was subsumed by more urgent priorities. Sonia and I are unlikely to pick this up again ourselves, but I don’t rule out the possibility that someone could get it to work, and if anyone out there is trying, I’ll be very interested to hear how it goes.

About Eric Vallabh Minikel
Eric Vallabh Minikel is on a lifelong quest to prevent prion disease. He is a scientist based at the Broad Institute of MIT and Harvard.