What's the deal with GPI-anchored proteins?
GPI-anchored proteins are the odd man out. In introductory Cell Biology, they taught us that there were five types of membrane proteins, named as follows: Type I, Type II, Type III, Type IV, and GPI-anchored. Why do we have this strange class of proteins fused to a sugar-and-fat chain? What do they do? Can we gain any insights into my protein of interest — PrP — by learning more about this class of proteins it is a member of?
Sonia and I and our teammate Andrew and have been doing some reading on this subject and I’m writing this blog post to share some of what we learned.
reading
We started out by reading a few reviews [Ferguson & Williams 1988, Englund 1993, Udenfriend & Kodukula 1995, Mayor & Riezman 2004, Fujita & Kinoshita 2010, Kinoshita & Fujita 2016]. These mostly covered the structure and biogenesis of the GPI anchor itself, about which an amazing about is known.
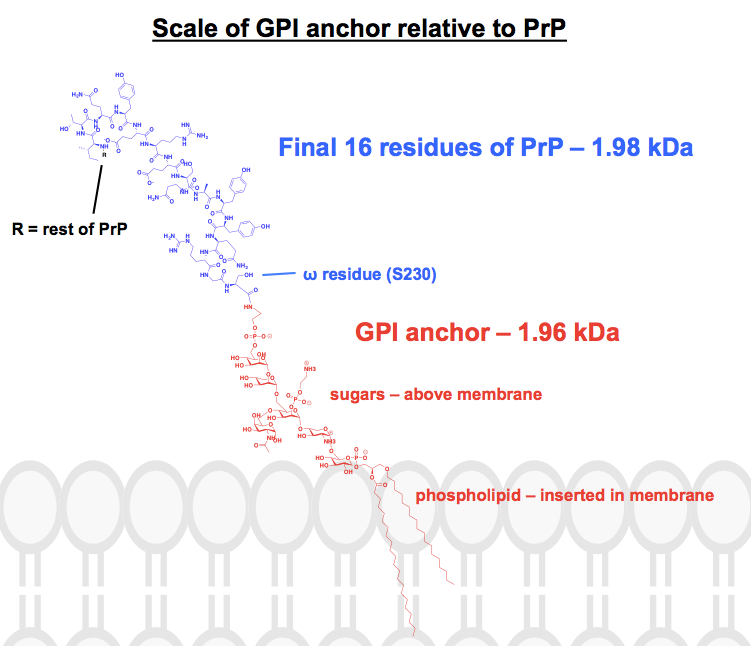
This anchor, whose full name is glycosylphosphatidylinositol, is not a monolith: it’s a general description of a molecule whose details may vary. In general, starting from the ω (last post-translationally present) residue of the protein, you have ethanolamine, then a phosphate, then some sugars, then a phospholipid. The core sugar backbone is conserved, but the side chains branching off of it can vary, and the phosholipid head group and fatty acids can both vary as well. PrP’s GPI anchor was characterized in [Stahl 1992], but even then it’s not a monolith — they identified at least six different structures differing in sugar side chain composition.
Every chemical structure I have found of GPI anchors has at least some parts abbreviated or summarized, and the protein is usually just shown as a picture. I wanted to get a sense of what these anchors actually look like chemically, in the context of their attached proteins, so I set out to actually draw one complete structure in ChemDraw. Working from Figure 1 of [Paulick & Bertozzi 2008] — the closest thing to a complete skeletal structure I could find — I added on the details of one of PrP’s GPI anchors from the top panel of [Stahl 1992] Figure 6. The molecular weight came to 1,958 Da, so for context I drew in the final 16 residues of HuPrP23-230, which weigh in comparably, at 1,979 Da. This is about 8% of PrP’s post-translationally modified sequence. I am not certain I got every bond right, but here’s what I came up with:
In many cases, a gene has multiple isoforms, with one splicing product giving rise to a GPI-anchored protein while others give rise to secreted or transmembrane forms. Examples include NCAM1, which has three major isoforms, one of which is GPI-anchored and the other two of which are transmembrane [Owens 1987], and ACHE (encoding acetylcholinesterase), whose GPI-anchored form is apparently found only on red blood cells (NCBI Genes). The most fascinating story here is that of the mouse gene Ly6a which, thanks to a genetic polymorphism, is GPI-anchored in some mouse strains and not others. Only in its GPI-anchored form, it acts as the receptor for the viral vector AAV PHP.eB [Huang 2019]. (This vector achieves amazingly efficient uptake into brain neurons for gene therapy [Chan 2017], but sadly, it’s a mouse gene only — we humans don’t even have Ly6a).
A lot is known about how GPI anchors get synthesized and attached to proteins [Kinoshita & Fujita 2016], with >20 proteins involved in the pathway, most of which start with the prefix “PIG” and are encoded by genes such as PIGA, PIGK, and so on — see Figure 2 for a diagram. Most of the biosynthesis takes place with the anchor inserted in the membrane in the ER but not attached to any protein. In fact, the first few steps take place on the cytosolic leaflet of the membrane, and only later does the anchor flip to the lumenal side (inside the ER). The final step is when GPI transamidase, a complex comprised of at least five proteins, cleaves the GPI signal off of the protein’s C terminus and attaches the GPI anchor to the so-called ω residue of the protein (the last residue in the post-translationally modified sequence). There is then further maturation of the GPI anchor as the protein migrates out of the ER toward the cell surface.
There exist a number of small molecule inhibitors of GPI biosynthesis in fungi, some of which people have tried to develop as antifungal drugs [Kinoshita & Fujita 2016], but as far as I could tell, the only known inhibitor of GPI biosynthesis in mammalian cells is mannosamine, a mannose analog that is chemically incompatible with incorporation into GPI [Pan 1992, Sevlever & Rosenberry 1993].
I looked and looked for a sequence logo of what amino acid sequence motif GPI transamidase recognizes, but found none. Apparently the sequence motif is quite loose [Eisenhaber 1999], and apparently the GPI signals are not even homologous [Englund 1993], meaning they did not evolve from a common ancestral sequence, but rather evolved convergently, to the extent that there is even any convergence. The best description I’ve been able to find is that (reading N-to-C-terminal up to the end of the protein) you need 1) about 11 residues of an unstructured linker, 2) a few residues with small side chains including an ω residue which can be either S, N, D, G, A, or C, 3) a spacer of 5-10 polar amino acids, and finally 4) 15-20 hydrophobic amino acids [Eisenhaber 1999, Kinoshita & Fujita 2016]. PrP loosely follows this motif. According to published structures [e.g. Antonyuk 2009], alpha helix 3 ends at residue Q223, which leaves the ‘unstructured linker’ as just AYYQR (somewhat shorter than the prescribed 11 residues). The ‘small side chain’ region would be GS|SM (with the pipe denoting the transamidase cut site), the polar region would be VLFSSPP, and the hydrophobic C terminus as VILLISFLIFLIVG.
Some of the proteins in the GPI biosynthesis and attachment pathway are very important, and a number of severe diseases and syndromes of GPI anchor deficiency have been described, due to biallelic loss-of-function or apparently hypomorphic missense mutations in genes like PIGO, PIGV, PIGW, PGAP2, and PGAP3 [Kinoshita & Fujita 2016].
Sonia found an excellent paper from a few years ago where they did a mutagenesis screen in haploid human cells to identify genes required for biogenesis of two GPI-anchored proteins: PrP and CD59 [Davis 2015]. They used repeated FACS sorting of cells based on cell surface PrP and CD59 in order to identify cells with dramatically reduced surface levels of these proteins, and then did sequencing to see which gene knockouts were enriched in those cells versus the parent population. As you’d expect, most of the PIG genes came up for both proteins (Figure 4), but not all hits overlapped, which is a bit surprising, especially since at the RNA level, at least, PrP and CD59 are two of the proteins with the most similar expression profiles across tissues (see heat map at the bottom of this post). A bunch of enzymes involved in GPI anchor side chain modification turned up only for CD59, suggesting that CD59, but not PrP, needs these complex side chains in order to mature and reach the cell surface. Meanwhile, Sec62 and Sec63 turned up only for PrP — these are proteins somehow involved in co-translational translocation into the ER, but apparently, they are needed for PrP but not for CD59 nor for CD55 or CD109, two other control proteins they looked at. This is a fascinating new chapter in the answer to my question, “is anything special about PrP’s expression?”, where I was looking for anything unique about the biogenesis of PrP that could be potentially targetable with a small molecule. Of course, just because these proteins weren’t important for three other control proteins in [Davis 2015] doesn’t mean they are not important — one study found that Sec62 was needed for secretion of many small proteins [Lakkaraju 2012], and the SEC62 gene is totally depleted for loss-of-function variants in the human population, enough to suggest haploinsufficiency. SEC63 appears less constrained, though that could just mean it acts recessively.
None of the above answers the question of why GPI-anchored proteins exist. My old cell biology class omitted a detail, by the way: there is actually a sixth class of membrane proteins, called tail-anchored (TA) proteins [Hegde & Keenan 2011], which just have a hydrophobic C terminus that sticks into the membrane but does not protrude out the other side. Why couldn’t all of these GPI anchored proteins just be TA proteins? Why did cells evolve such a complicated pathway to synthesize a sugar-fat anchor instead, and why did they evolve it so early in the game — GPI anchors are present throughout eukaryotes including in many single-celled pathogens that infect humans.
Most of the reviews did not spend much time on this question, probably because it’s the hardest thing to answer. The GPI-anchored proteins themselves, to the extent that their native functions are known, have a huge range of functions — there are enzymes (such as AChE), cell adhesion molecules (such as NCAM1), proteins that regulate complement in the immune system (CD59), and so on [Paulick & Bertozzi 2008]. There is apparently at least one GPI-anchored protein involved in myelin maintenance in peripheral nerves [Kuffer & Lakkaraju 2016]. But what exactly can GPI-anchored proteins do that other proteins can’t? One review [Kinoshita & Fujita 2016] cites a few ideas that have been proposed. One is that GPI-anchored proteins are good at transiently dimerizing [Suzuki 2012]. Some studies have explored the idea that homodimerization plays some role in prion biology [Meier 2003, Beland 2012], though the relevance of the model systems used there to the in vivo situation is not yet clear. Another idea is that because GPI-anchored proteins can be shed from the cell surface, for instance by angiotensin-converting enzyme (ACE) [Kondoh 2005], their localization can be regulated in some dynamic way. Here too, we know that PrP can be shed, apparently by the enzyme ADAM10 [Altmeppen 2011, Linsenmeier 2018], though any role in PrP native function is not yet clear. A third idea, and perhaps the one I have heard the most talk about, is that GPI-anchored proteins selectively congregate in “lipid rafts” [Brown & Rose 1992, Simons & Ikonen 1997]. This is perhaps the most enticing explanation, because you could imagine all kinds of knock-on effects, where the increased effective local concentration of these proteins allows for more interactions, and so on. But one review pointed out that a caveat is that lipid rafts are still more of an abstract idea than a concrete thing [Mayor & Riezman 2004] — while they are functionally defined by detergent insolubility and most people describe them as being rich in sphingomyelin and cholesterol, there is no universally accepted definition of what is and is not a lipid raft, and the empirical evidence suggests they may be much smaller and more transient than most people think.
With that reading in hand, I set out to get a list of these proteins and do some analysis on them to see if I could get a better sense of what they’re like.
analyses
Uniprot has a list of 173 human GPI-anchored proteins. These mapped to 140 gene symbols, which dropped to 135 after running this script to update to currently HGNC-approved protein-coding gene symbols. The final list of 135 gene symbols is here.
Uniprot doesn’t offer any info on how their annotations were generated, though there must be a significant degree of manual curation. For comparison, Andrew also dug up a series of neat papers that used PI-PLD or PI-PLC, two enzymes that cleave GPI anchors, to empirically isolate GPI-anchored proteins from cells [Elortza 2006, Cortes 2014, Masuishi 2016]. Combining lists from these papers and mapping to current gene symbols yielded 107 genes. We spot-checked several of these at random. Among them were well-known GPI-anchored proteins such as glypican-1 (GPC1) and neural cell adhesion molecule (NCAM1), both of which are reported to have interactions with PrP [Schmitt-Ulms 2001, Taylor 2009]. But also present were several genes for which no GPI anchoring seemed to be known in the literature, such as VDAC3, some of which may simply be very abundant proteins or false positives for other reasons. Meanwhile, there are obvious sources of false negative: genes that simply weren’t expressed in the cell line studied, or weren’t abundant enough to pick up by mass spec, and the PrP paralogs SPRN and PRND weren’t in the lists. Overall, 51 genes were in both lists, a highly significant enrichment (OR = 217, P < 1 × 10-84), which helps reassure me that Uniprot’s annotations are consistent with empirical data. But for further analyses we decided to go with the Uniprot list as it seems more sensitive and specific.
Armed with this list, I wanted to see how GPI-anchored proteins stack up. PrP is a single exon, short (208 amino acids in its mature form), non-essential, broadly-expressed protein. Are these features typical or atypical for a GPI-anchored protein?
It turns out that GPI-anchored proteins are all over the map, just as variable on every dimension I looked at as any other set of proteins are.
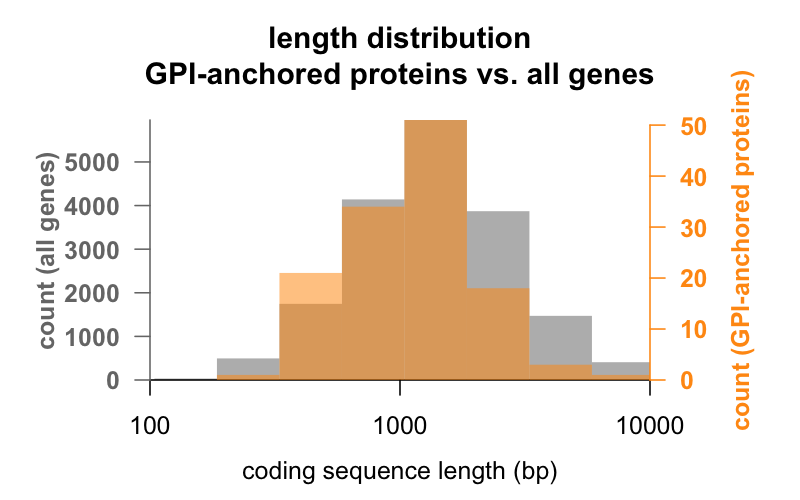
First, length. Below are overlaid histograms of the coding sequence length in base pairs for all genes, versus genes encoding GPI-anchored proteins. The GPI-anchored distribution is just barely left-shifted. The average GPI-anchored protein gene has 1,301 bp of coding sequence, while the average gene has 1,729, but this difference of means is small compared to the variation within each group. PrP, with just 762 bp of coding sequence, is definitely on the small side, though by no means an outlier in either group — CD52, with just 186 base pairs of sequence and apparently only 12 amino acids in its mature form [Xia 1991], is the smallest GPI-anchored protein.
What about number of exons? GPI-anchored proteins do have slightly fewer exons on average, compared to all genes (mean 7.8 vs. 10.1), consistent with the slight length distribution difference noted above, but most are multi-exon. Here, too, PrP is on the small side: there are only six GPI-anchored proteins that have just 1 coding exon, and three of them are PrP and its two paralogs, Sho and Dpl. (The other three genes are GAS1, SPACA4, and the fabulously named OMG).
Next I looked at loss-of-function constraint. Constraint [Samocha 2014, Lek 2016] is a measure of how strong of natural selection a gene is under, based on how depleted it is for, say, nonsense, frameshift, and splice site variation in the general population compared to expectation based on mutation rates. This metric is not very interpretable for short genes, both for statistical reasons (the number of expected mutations is low for short genes, so it is hard to quantify depletion) and biological reasons (single exon genes aren’t subject to nonsense-mediated decay, so it is harder to know if protein-truncating variants are really “loss-of-function” or not). But since most GPI-anchored proteins are not as short as PrP, I thought it was worth taking a look. The result: on average, GPI-anchored proteins are just slightly less constrained, meaning they have more of their expected amount of loss-of-function variation, than the average gene. The average gene has 47% of its loss-of-function variation, and GPI-anchored proteins have 56%. But as with everything here, there’s a wide distribution in both camps. For GPI-anchored proteins, you have the absolutely constrained ACHE (17 LoFs expected and none observed) at one end and, at the other end, several genes that appear to be under no selection against loss-of-function at all — CNTN6, CD109, TREH, and MSLN are a few examples. PRNP falls in the latter camp once you exclude residues ≥145 where protein-truncating variants cause a gain of function [Minikel 2016, Minikel 2019].
Finally, I wondered where GPI-anchored proteins are expressed. PRNP is highest in the brain but is expressed everywhere. Is that typical? I downloaded the full GTEx v7 “gene median tpm” summary file (Jan 15, 2016), where every row is a gene and every column is a tissue and the cells are RPKMs — RNA-seq reads per kilobase of exon per million mapped reads. Working with this dataset took some finessing. I’ve heard that some bioinformaticians consider <1 RPKM to be “not expressed” but the expression matrix is sparse — most genes are not highly expressed in most tissues — so the noise below 1 RPKM can dominate if you just plot the raw RPKMs. Meanwhile, gene expression is something that you need to think of on a log scale, as genes in a tissue can vary from <1 RPKM to >10,000 RPKM, so if you consider everything on a linear scale, then the few really highly expressed gene/tissue combinations can also dominate, making the matrix look even sparser than it is. I therefore took log10 of the matrix and truncated the distribution at [0,4], thus, the purple scale I used runs 1 - 10 - 100 - 1,000 - 10,000 RPKM. Then I subsetted to the Uniprot GPI-anchored proteins. To visualize this, I made a heatmap for the first time in my life. I’ve often seen these in papers and they usually don’t speak to me, but here my goal was just to get a sense of the pattern of expression, and after playing around a bit, this was what gave me the most insight. The principle of a heatmap is that the rows and columns are clustered so that similar things go together. Thus, for instance, all the brain tissue columns are lined up consecutively in a patch on the x axis, and all the highly brain-expressed genes are lined up consecutively in a patch on the y axis, so that their intersection forms a dense purple rectangle that can be interpreted as, “there exists a cluster of genes that are mostly brain-expressed”.
Interested readers can view the full-scale vector art PDF of the heatmap, but to make it more immediately accessible, here is a hand-annnotated version calling out the clusters of interest:
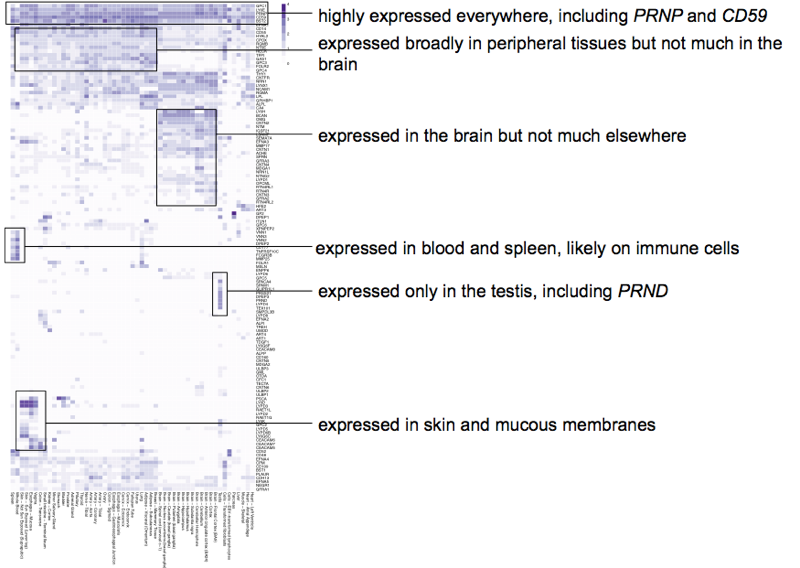
The answer, then, is no — most GPI-anchored proteins do not have the same expression pattern as PRNP does. PRNP is one of the handful of more highly and broadly expressed ones, featuring near the top of this heatmap, along with CD59, LY6E, GPC1, and BST2. Most GPI-anchored proteins have lower or more tissue-restricted expression, with some almost uniquely expressed in the brain and others almost uniquely not expressed in the brain, and other smaller clusters belonging chiefly to specific tissues like the testes, such as PrP’s paralog PRND, whose knockout causes male sterility [Behrens 2002, Paisley 2004].
conclusions
GPI-anchored proteins can be just about any size, expressed in just about any tissue, and apparently have just about any function, to the extent that their functions are known. Many GPI-anchored proteins have very clear native functions, but these functions are diverse and it is not clear why they require GPI anchoring, especially since many of these proteins exist in non-GPI-anchored isoforms as well. Meanwhile, for other GPI-anchored proteins, including PrP, we know little enough about native function to begin with, so it is difficult to even speculate why the native function requires GPI anchoring. None of the analyses I did or reviews I read were able to draw a unifying principle as to why this anchoring mechanism exists or what makes these proteins require it. There are a number of hypotheses for why GPI-anchored proteins are unique, including lipid rafts, homodimers, and shedding. All of these hypotheses may hold some water. But at the end of the day, the answer seems unlikely to be a eureka moment, but rather, like so much of biology, a prosaic mix of different things.
R code and raw data files for analyses in this post are here.

About Eric Vallabh Minikel
Eric Vallabh Minikel is on a lifelong quest to prevent prion disease. He is a scientist based at the Broad Institute of MIT and Harvard.