The London study: plasma NfL in pre-symptomatic genetic prion disease

Queen Square in London, the site of a 12-year biomarker study in prion disease patients and people at risk.
For twelve years now, Simon Mead and his team at University College London / MRC Prion Unit have been following symptomatic prion disease patients and pre-symptomatic at-risk individuals in a longitudinal cohort study. After a first peek at some results at Prion2019, last week we finally got to read a full manuscript worth of biomarker findings [Thompson 2020]. The results are important and interesting, and their interpretation is not trivial, so I am devoting this entire (long) blog post to unpacking it.
importance
Across therapeutic areas, the use of biomarkers in clinical trials is associated with a higher success rate for reaching drug approval [Wong 2019]. I expect that prion disease will be no exception, and this goes for both of our patient populations: symptomatic and pre-symptomatic.
In the symptomatic population, previous trials have randomized patients to drug or placebo to see who lives longer [Geschwind 2013, Haik & Marcon 2014]. At a minimum, in such trials, it’s critical to make sure everyone in the trial actually has prion disease and not something else, and the statistical power of the trial — the probability of a positive result if the drug works — should be increased if one can control for other variables that affect patients’ survival time. In other words, we want good diagnostic and prognostic biomarkers to select and stratify patients. But that’s not all — one can imagine that maybe biomarkers that track the disease process in real time could allow shorter or smaller trials, or allow everyone to receive active drug at some point in the trial.
In the pre-symptomatic population, the role of biomarkers is likely to be even larger. Our patient population is small enough, and age of onset variable enough, that randomizing people to disease onset is just not numerically feasible [Minikel 2019]. The only way we’ll be able to do trials to prevent prion disease before it starts is through the use of biomarkers. Sonia and I have proposed one way such trials could be done [Vallabh 2020a]: for a PrP-lowering drug, measurement of PrP in cerebrospinal fluid (CSF) could show that the drug has done its job, and PrP is so inextricably tied to disease that this measurement could carry the weight of a provisional drug approval. Still, the desire to have additional lines of evidence that a drug works, and the desire to be able to test drugs with other mechanisms of action — that do not lower PrP — is a strong motivator to continue studying biomarkers in people at risk for prion disease.
In other neuodegenerative diseases, such as Alzheimer’s and Huntington’s, there is ample evidence of a prodromal disease process underway decades before symptoms actually strike [Bateman 2012, Byrne 2017]. In prion disease, prodromal change has been more elusive. Studies using MRI and FDG-PET brain imaging have found only subtle changes, recognizable in hindsight, no more than 14 months before disease onset [Cortelli 2006, Satoh 2011, Terasawa 2012, Cohen 2015, Verde 2016, Zanusso 2016]. Nerve conduction changes were present only at the time of onset [Rudge 2019].
That leaves fluid biomarkers. Sonia and I launched a study of genetic prion disease mutation carriers in 2017, and recently reported a first round of results showing that cross-sectionally, most mutation carriers have normal CSF and blood biomarkers [Vallabh 2020b]. That argues that prion disease may not have anything approaching the long prodrome of Huntington’s or Alzheimer’s. But because our study is young, we haven’t yet got much longitudinal follow-up on people and we’ve thankfully not had a participant develop disease during the study. Luckily we are not the only ones interested in this area. Simon Mead’s National Prion Monitoring Cohort has been recruiting participants in London since 2008, and Michael Geschwind’s Early Diagnosis of Prion Disease study has been recruiting participants in San Francisco since 2001. Raquel Sanchez in Barcelona and Noa Bregman in Tel Aviv are now also collecting biofluid samples from at-risk people.
The new paper from Simon Mead’s group provides our first look at these sorts of longitudinal results. It’s a work of great scale and incredible patience, encompassing a total of 709 samples from 377 patients (mostly symptomatic), collected over the course of 12 years. They focus on two blood plasma biomarkers: total tau (T-tau) and neurofilament light chain (NfL). These are both proteins produced in neurons in the brain, that leak out into the blood when neurons are damaged or dying. In other neurological diseases, these markers become elevated before onset of disease, track with disease progression, and/or can respond to treatment (reviewed in this post). We recently showed that in prion-infected mice, plasma NfL rises before symptom onset and can be temporarily reversed by treatment with PrP-lowering antisense oligonucleotides [Minikel 2020]. All of these properties make these markers good candidates to examine in prion disease.
The most interesting part of the paper is the data on pre-symptomatic individuals, and that’s what this blog post will focus on. But because half the paper and most of the samples analyzed in it are from symptomatic patients, I’ll first cover briefly what the study says about plasma biomarkers in symptomatic prion disease.
symptomatic patients
The first half of the paper is devoted to biomarker findings in symptomatic prion disease patients. The technology to quantify neuronal damage markers in plasma is relatively new, so this is an emerging area over the past few years. Most of the key findings reported here in symptomatic patients replicate findings from this group’s smaller report a couple of years ago [Thompson 2018] and/or from other cohorts worldwide [Steinacker 2016, Kovacs 2017, Staffaroni 2019]. Nothing here is completely new or surprising, however, it is useful to see these markers examined in a cohort both larger, and more diverse in terms of disease subtypes, than any previous cohort.
In sporadic CJD and, to a lesser extent genetic prion disease, both plasma tau and NfL were wildly elevated compared to healthy controls and even compared to slower dementias — Alzheimer’s and frontotemporal dementia. Prion disease patients are only occasionally confused with Alzheimer’s patients, though, so the real test of a biomarker is whether it differentiates prion disease from other diseases that present the same way — “CJD mimics”. Plasma T-tau, especially, was even more elevated in CJD than in CJD mimics, meaning it could offer some help in differential diagnosis. Of course, nowadays, differentiating CJD from its mimics is easy — if a neurologist has sufficient suspicion of CJD do a lumbar puncture and send CSF for RT-QuIC. Which is a big “if”. So in the Discussion, the authors propose that because plasma is more readily accessible than CSF, perhaps plasma tau could be assessed more widely in any patient where CJD is potentially in the differential diagnosis, and any patient above some cutoff such as 100 pg/mL would be prioritized for RT-QuIC.
Plasma tau was also higher in patients experiencing a more rapid decline, and NfL was higher at more advanced disease stages. Importantly, both tended on average to increase longitudinally over the disease course, albeit with a fair bit of noise. As I’ve argued in this post, longitudinal change is important because it allows clinical trials to test for whether a therapeutic intervention stabilizes that change. Up to now, we had seen some hint of longitudinal change in these markers, but based on only a handful of patients [Thompson 2018].
In principle, if a biomarker is correlated with disease stage and/or with rate of progression, then it might be prognostic, meaning it might have predictive value for how long a patient will survive. In practice, what matters is whether the biomarker has additional prognostic value when added to the prognostic tools the physician already has in hand. Michael Geschwind’s CJD cohort at UCSF provides a nice example of this [Staffaroni 2019]. Within that patient cohort, having CSF T-tau above a particular diagnostic cutoff was highly predictive of a short survival time on its own, but in a combined model with Barthel index (a measure of functional impairment) and PRNP codon 129 genotype (which explains much variability in disease duration), it turned out not to actually add anything. On the flipside, plasma T-tau was fairly predictive on its own, but became even more strongly predictive when combined with Barthel index and codon 129. In the London study, they controlled for a patient’s level of impairment on a different rating scale, the MRC Scale, as well as PRNP codon 129. Like the UCSF study, they found that plasma T-tau did offer some additional predictive value, although it was a small effect driven mostly to people with 129MM, the fastest-progressing genotype.
pre-symptomatic patients
The second half of the paper focuses on pre-symptomatic people at risk for genetic prion disease. In total, they collected 117 blood samples from 31 different at-risk individuals who were asymptomatic at the time, of whom 9 later developed disease at some point during the 12 years of the study. They measured both plasma T-tau and NfL. The stories of these two biomarkers end up being similar except for the fact that T-tau is noisier, so I’ll focus on walking through what they saw for NfL. Here are the two panels of Figure 4 that address plasma NfL in these individuals:
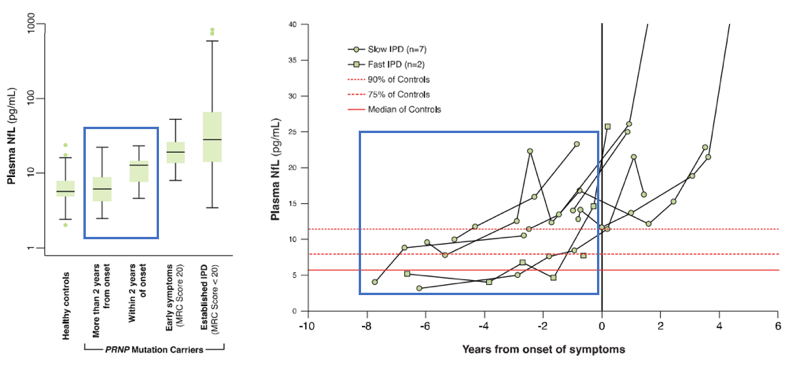
The boxplot at left compares the distributions of plasma NfL levels in healthy controls, asymptomatic at-risk people >2 years from onset, those ≤2 years from onset, those in the early stages of disease, and those with advanced disease. All of these distributions overlap, but on average there are some differences. It’s not surprising that plasma NfL in symptomatic individuals, whether in early or advanced stages, is elevated above controls. I have added a blue box to highlight the comparison here that is really interesting: in terms of group-wise averages, plasma NfL is higher in people close to onset than in those further out from onset.
Likewise at right, we have the individual plasma NfL trajectories of the 9 people who developed disease. Again, it’s the trajectory before onset, which I’ve highlighted in blue, that is of interest for this blog post.
The key point is that several readings within one year of onset, as well as two or three readings as early as about year and nine months before onset, are elevated above these individuals’ earlier baselines, with a progressive upward trend observable in the individuals with the greatest number of sequential readings. This appears to be our first evidence of neuronal damage detectable through a fluid biomarker before onset of symptoms, our clearest-yet glimpse of some kind of prodrome in genetic prion disease. That’s an important conceptual advance, and could have meaningful implications for therapeutic development in prion disease.
Based on these data, the authors conclude that plasma NfL could serve as a “prodromal” or “proximity” marker that would enrich for patients close to disease onset: “enrolled patients would be more likely to develop symptoms in the timeframe of a trial, and greater risks of treatment might be justified than in those without evidence of an active disease process.” They further note that plasma T-tau and NfL could be used “in a clinical trial setting as secondary outcomes” and that “further prospective study” of NfL would be desirable for the purpose of “defining a prodromal window size and testing the value of biomarker trajectory rather than absolute level in prediction”.
It’s clear that those conclusions were written with great thought and care. I really admire Simon Mead and Andrew Thompson for their understated tone, which is rivaled only by their patience in gathering this dataset in the first place. I suspect that many investigators, faced with the same data, would feel inclined to shout from the rooftops: lo, we have a prodrome! I’ve also been in science long enough to know just how many investigators read only the abstract, or only half-listen to the conference talk while multitasking, and who therefore might internalize nothing except the punchline of this study: plasma NfL elevated 2 years before onset of genetic prion disease. That thought scares me, because without context, that punchline risks leading people to three conclusions that the authors do not reach, and that the data do not support:
- That elevated NfL should be an inclusion criterion for preventive trials
- That lowering NfL should be a primary endpoint in preventive trials
- That once a preventive drug is approved, we should wait to see an individual’s NfL start to rise before starting drug treatment
Indeed, this is the reality Sonia and I have been living for the past few years: in conversations with people ranging from NIH officials to industry scientists to concerned family members, we usually get the question, or worse, the assumption, that our plan is precisely this. To do a preventive trial where we recruit people with prodromal change, measure whether we’ve reversed that change as a trial outcome, and then monitor mutation carriers for prodromal change and start drug treatment once we see it. At one point last year, we walked into a meeting, said names and shook hands, and then literally the first sentence uttered was: “So you guys are going to treat when NfL goes up, right?”
Why do so many people assume this? Probably because in Alzheimer’s disease, although prevention is still far from being business as usual, a few highly publicized, groundbreaking trials have begun to test this model. People assume that prion disease will do whatever Alzheimer’s disease does. But while the data may support this model in Alzheimer’s, they do not currently support it in prion disease.
So, to make sense of what the London study means, and how it could be useful, we must wade into three important details: genotype, age, and the difference between longitudinal and cross-sectional analyses.
genotype
Genetic prion disease spans a spectrum from very rapidly to slowly progressive disease. Worldwide, of patients with highly penetrant PRNP mutations, about two-thirds have “rapid” mutations, and about one-third have “slow” mutations. Due to whatever founder effects and historical accidents, this ratio is inverted in the U.K., where roughly two-thirds of patients have slowly progressive mutations. This paper doesn’t provide the breakdown of how many of the pre-symptomatic patients had which mutations, but of the symptomatic genetic prion disease patients evaluated here, 62/83 (75%) had slowly progressive mutations. Dichotomizing “rapid” versus “slow” doesn’t even tell the full story. Different mutations can be profoundly different in terms of disease duration. The most common “rapid” mutations, E200K and D178N, have median survival of 6 and 12 months respectively. The most common “slow” mutation, P102L, has a median survival just shy of 5 years, but people with some mutations, such as 6-OPRI, can survive decades of slow decline. Here is a table comparing the top mutations:
| mutation | median duration | worldwide prevalence | U.K. prevalence |
|---|---|---|---|
| E200K | 6 months | 49% | 25% |
| P102L | 4.8 years | 19% | 23% |
| D178N | 12 months | 18% | 8% |
| 6-OPRI | 14.0 years | 4% | 23% |
| 5-OPRI | 8.2 years | 2% | 9% |
| A117V | 2.3 years | 2% | 8% |
| P105L | 8.8 years | 1% | 1% |
Global and U.K. prevalence and disease duration of the 7 most common PRNP mutations. Based on disease duration data from [Minikel 2019] and prevalence data from [Minikel 2016]. These top 7 mutations account for 95% of worldwide cases and 97% of U.K. cases.
The effect of this shifted mutational distribution is to make disease duration longer in the U.K. than elsewhere in the world. For instance, across all mutations, the proportion of patients still alive at 24 months post-onset is 29% worldwide but 57% in the U.K.
Now, in the London study, 7 of the 9 at-risk patients who developed disease during the study had PRNP mutations associated with slowly progressive forms of prion disease. Those patients’ data really drive the story in this paper. When we look at the 2 patients with rapidly progressive mutations, we see a different story. Here are the data from Fig 4b, re-plotted with only data points prior to onset, with the full healthy control range shown for reference, and with slow and rapid mutations broken out in to separate plots:
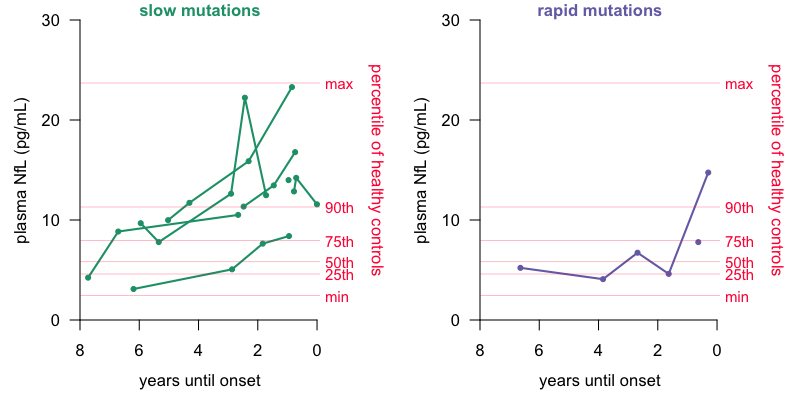
Plasma NfL readings prior to onset in slow vs. rapid mutation carriers who became symptomatic. 50th, 75th, and max of healthy controls are from Table 1 of [Thompson 2020] and all other data points are from Fig 4 via Engauge Digitizer.
Among rapid mutations (right), one patient had a pre-symptomatic reading of about 15 pg/mL NfL, well above that patient’s own baseline, and above most controls, but this occurred only about 4 months before disease onset. The other patient had no longitudinal data, just a single reading perhaps 7 months before onset, which was well within the normal range.
It’s plausible that the mutations such as 6-OPRI, whose disease duration more resembles that of Alzheimer’s disease, may have a long, slow prodromal rise in NfL, while for E200K and D178N, that increase seen in one patient 4 months before onset may be the only whiff of the oncoming freight train. If so, then for the majority of people at risk of genetic prion disease, this study does not change what we have suspected based on those earlier imaging studies and on cross-sectional data: that any prodrome is likely to be brief, just as the disease course is brief.
There is no doubt, people with slowly progressive mutations are an important patient population too, so the London findings are still significant. Indeed, perhaps people with slow mutations could play some outsize role in clinical trials. But, this is already a pretty rare disease, so if a biomarker only gives a predictive signal in a minority of patients, that does constrain how that biomarker might be applied. I will discuss this more below.
age
Plasma NfL increases 2.2% per year even in healthy controls. This statistic comes from [Disanto 2017] based on a regression of 87 healthy controls age 18 to 70. In Table 1 they present different percentile cutoffs by age. Because 1.02232 ≈ 2.0, the upshot is that NfL doubles every 32 years. A healthy person age 62 is expected to have about twice the blood NfL concentration of someone at age 30.
Now, to be clear, age-related change is not a plausible explanation for the upward tick in NfL observed in these 9 individuals prior to onset. I used Engauge Digitizer to extract the data points from Fig 4B and then did a log-linear regression on all of the data points occurring prior to onset, controlling for differences between the 9 individuals:
> m = lm(log(nfl) ~ years + indiv, data = subset(nfldata, years < 0))
> model_results = as.data.frame(summary(m)$coefficients)
> colnames(model_results)[c(1,4)] = c('beta','p')
> model_results$expbeta = exp(model_results[,'beta'])
> model_results = signif(model_results,3)
> model_results[1:2,c('beta','expbeta','p')]
             beta expbeta        p
(Intercept) 2.880   17.90 9.30e-11
years       0.156    1.17 3.97e-05
The model says that the intercept, the average NfL level at the moment of onset, is 17.9 pg/mL, and in the years leading up to that onset, the average increase in NfL is 17% per year (P = 3.97 × 10⁻⁵). In other words, NfL is rising far faster in these people than the 2.2% per year that we would expect based on age alone.
Yet age is still important, for the following reason: it affects how we interpret the absolute level of NfL in these individuals. Consider that 15 pg/mL reading 4 months before onset in a rapidly progressive individual mentioned earlier. We aren’t told the age of that individual, but if they were young, 15 pg/mL could be alarmingly anomalous, while if they are at the average age of onset for the E200K mutaton, which is about 62, it might still fall well within the expected distribution. (We don’t know for sure because an age regression isn’t shown for the healthy controls in this study, and differences in pre-analytical variables might preclude direct comparison to the reference ranges from [Disanto 2017].)
Importantly, the longitudinal trajectory for this particular individual could provide a danger signal whether or not the absolute level of NfL is exceptional. Still, having only observed longitudinal data for one individual with a rapidly progressive mutation leading up to onset, it’s hard to say with what sensitivity and specificity that danger signal could be interpreted. Hence the authors’ conclusion that continued prospective study of NfL is warranted, with a focus on biomarker trajectory over time.
cross-sectional versus longitudinal
A strength of this study is the incredible duration of longitudinal follow-up, and the analyses focus on that aspect. But it is equally important to consider a cross-sectional view into PRNP mutation carriers’ biomarkers. Clinical trials don’t enroll in a day, but they also don’t spend 12 years recruiting. To a close approximation, the task of enrolling a clinical trial comes down to the question: who meets the inclusion criteria today?
The cross-sectional picture is never presented in its entirety, but we can piece some of it together from different places in the paper. They studied 23 individuals who remained asymptomatic throughout, and who donated a total of 70 blood samples. They also studied 9 individuals who became sick, who donated a total of 47 blood samples, of which 29 samples were taken prior to onset. Thus, in total, the study encompasses 70 + 29 = 99 blood samples from asypmtomatic-at-the-time mutation carriers. Of the 29 samples from people who later developed disease, 14 samples had NfL above the 90th percentile of healthy controls, which appears to be about 11.3 pg/mL, and in 9 of those 14 cases, disease onset occurred within the subsequent 2 years. Of the 70 samples from people who haven’t yet gotten sick, we can guess that at least 10%, or 7 samples, also had NfL above the 90th percentile of controls. (The actual count is probably a bit more, because the paper notes that the distribution of NfL levels in these people was just slightly right-shifted compared to controls). Thus, if one were to choose a cutoff of 11.3 pg/mL as a signal of oncoming disease, then a screen of 99 samples might yield 21 or more positives, and out of those 21, there would be 9 true positives, i.e. 9 samples from people who would develop disease in the next 2 years. Out of the 78 negatives, there would be 4 false negatives, i.e. 4 samples that didn’t make cutoff but were in fact from people who would develop disease in the next 2 years. (One caveat is that many/most individuals were sampled more than once, so the samples here are not totally independent and may not perfectly represent a cross-sectional sample.)
I really wanted to visualize this cross-sectional analysis, which is challenging because the full individual data for the healthy controls and the asymptomatic carriers who never got sick are never shown, we only see boxplots. I set out to do my best to simulate what the actual distribution might look like. Table 1 provides max, min, and quartiles. We also have the 90th percentile of healthy controls, and one additional outlier point from the boxplot in Figure 4A. The Methods states that the distributions were roughly normally distributed in log10 space. Based on these parameters, I tinkered around in R until I randomly generated distributions that matched all the reported percentiles within 0.1 pg/mL. So this is not the real data, I repeat, not the real data, but it’s my best guess at what the data might look like and I hope that it captures at least the spirit of the challenge that the paragraph above just described:
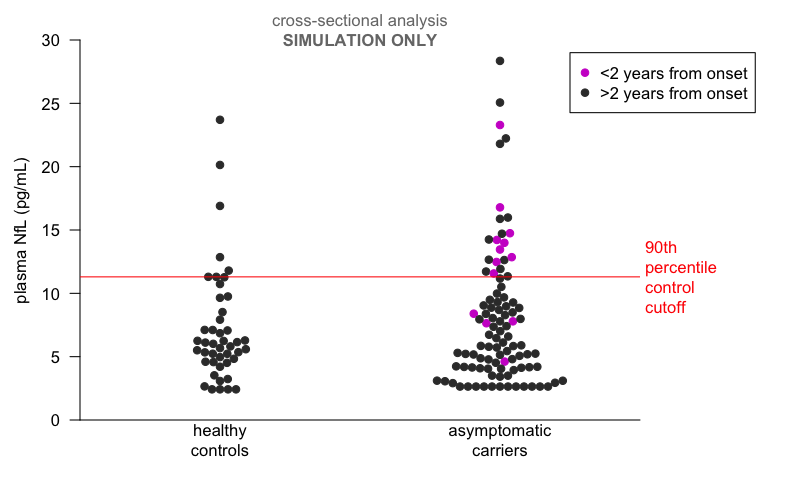
Simulated cross-sectional analysis of London plasma NfL data. These random distributions generated in R are log-normally distributed with mean=5.85 sd=1.7 for healthy controls and mean=5.7 sd=1.7 for asymptomatic carriers, with truncation for lower limit of quantification at the low end and known individual data points from the paper added in. They match the number of samples in each group and the percentiles of the simulated distributions match the reported percentiles within 0.1 pg/mL. The data points for asymptomatic individuals who converted to disease are real but approximate (via Engauge Digitizer). This plot might provide an impressionistic look at what a cross-sectional analysis of the real data would look like, but I cannot guarantee it.
You can see that at the roughly 11.3 pg/mL cutoff based on the 90th percentile of healthy controls, several mutation carrier samples not within 2 years of onset would qualify, while four mutation carrier samples within 2 years of onset fall well within the distribution. You could shift the cutoff up or down to trade off sensitivity against specificity, but there’s nowhere you could put it to capture all the people at most imminent risk without also including a lot of people whose onset is not imminent.
In sum, this study does not establish a highly sensitive and specific cutoff that would enable identification of prodromal individuals in a single screening step. Based on the normal biomarker findings in mutation carriers from our MGH study, we’ve been saying that cross-sectionally, most mutation carriers appear not to be in a prodromal state at any given time [Vallabh 2020b]. The authors note that the differences in patient population (distribution of mutations, described above) and length of follow-up (12 years versus our <2 years) might explain differences in our results. Those are good points and that explanation is perfectly reasonable, but it’s also not clear to me that there’s any difference in need of explaining. Viewed cross-sectionally, the London data agree that most mutation carriers are not in a reliably detectable prodromal state at any given point in time. That does not diminish the importance of this study or its findings, but it does speak to what we can and can’t do with these data today.
what plasma NfL can and can’t do today
Let’s circle back to my reason for writing this post. My concern that some readers will misinterpret this study to mean that prevention in prion disease means NfL as inclusion criterion, primary endpoint, and trigger for beginning therapy once a drug is approved. In light of the above three points, I want to walk through how exactly that would (not) work.
Your first task is to enroll a trial. How many pre-symptomatic mutation carriers are there? We have calculated based on genetic prevalence that there must be many thousands of such individuals worldwide [Minikel 2019], but many do not know they are at risk, and of those that do know, most haven’t pursued genetic testing. Thus, there are many people we can aspire to eventually reach with a drug, who we realistically will not yet be able to enroll in a trial today. As of 2017, the U.S. surveillance center had given out 221 positive predictive genetic test reports to still-asymptomatic people [Minikel 2019]. Our research volunteer registry, PrionRegistry.org, currently has 180 consented, enrolled individuals who identify as “healthy but at risk”. How many such folks have participated in clinical research so far? Our MGH study has 27 healthy mutation carriers enrolled [Vallabh 2020b]. The London study accrued 31 of them over 12 years [Thompson 2020]. The largest Israeli study followed 50 mutation carriers [Cohen 2015]. With a few well-chosen trial sites, it is reasonable to expect that presymptomatic mutation carriers who show up to be screened for a clinical trial will number in the high tens, maybe low hundreds.
Again, to be sure, there are many more people out there. An earlier U.K. study found only a quarter of people who learned they were at risk pursued genetic testing [Owen 2014]. A recent French cohort, selected for having proactively contacted a genetics center in the first place, still found that only two-thirds (20/30) eventually pursued testing [Schwartz 2019]. Availability of a drug, perhaps even just a trial, will hopefully motivate more people to get tested. But if even knowing one’s own mutation status puts many people off, consider asking people not just to find out if they have a mutation, but to find out if they have a marker of dead or dying neurons in their blood, indicative of a likelihood of disease onset within the next 2 years. Only those with that marker will be able to enroll in the trial. It’s a big ask.
Nevertheless, let’s suppose that you get 150 mutation carriers walking in the door for that first trial. On expectation, one-third, so 50, have slowly progressive mutations. You screen them and you find 10 people with NfL above your cutoff of, say, 11.3 pg/mL. One becomes pregnant, one has a contraindication to the drug being tested, and two are simply lost to follow-up. You enroll the other six people, all of whom are different ages and represent four different mutations. You randomize three to drug and three to placebo. Absent effective therapeutic intervention, about half on expectation (the 9/21 figure above), will become sick within the next two years, so your “best” case is to observe 1 or 2 onsets in the placebo group and 0 in the treated group. That’s an anecdote, not a piece of statistical evidence. So you don’t have a clinical outcome as your primary endpoint. Meanwhile plasma NfL is itself noisy, and we don’t yet know in any fine grain the expected trajectory for any individual based on their specific mutation and age, so you can’t use NfL as your primary endpoint either. This is not a clinical trial that is going to get a drug approved.
Now put all that aside and imagine that a drug is nevertheless approved, by some other mechanism. The question becomes when to treat pre-symptomatic individuals. Here, too, you could set some NfL cutoff such as 11.3 pg/mL to begin treatment. In people with slowly progressive mutations, this would mean about half the people you treat weren’t, in fact, approaching onset within 2 years (as 12/~21 samples >11.3 pg/mL were not within 2 years of onset), and meanwhile, you miss your window for intervention in about a third of people (as 4/13 people within 2 years of onset were ≤11.3 pg/mL). In rapidly progressive mutations, it’s even less clear what you do: given our only hint of a prodromal rise is just 4 months before onset, maybe you sample plasma monthly or weekly. And all that to enrich for people close to onset, even though that may mean missing your best window to prevent or dramatically delay disease, since preclinical data on every drug tested so far in prion disease mouse models suggest that the biggest benefit is achieved if you treat earlier. All told, this scenario is an absolute last resort: for a drug with any remotely tolerable side effect profile, I’d say please, just give me the drug now, we cannot afford to wait and hope to catch me after NfL rises but before symptoms start. We need to say this message loud and clear, because there will likely be pressure from payors — whether private insurers or national health care systems — looking to save money by not paying for a drug until the last possible minute, even if that last minute is too late.
conclusions
The narrative above may sound ridiculous, but it’s crucial that we think through what using NfL as a biomarker in trials actually means in practice. My point is not that NfL isn’t valuable or couldn’t have clinical utility in the future, it’s simply that we aren’t there yet — and no one who’s sat down with the data is saying that we are. The London data establish the existence of a prodromal NfL rise up to 2 years before onset in some patients with slowly progressive mutations, but we are still a long ways from where this could be used as an inclusion criterion, primary endpoint, or trigger for taking a drug. The findings reported here are an excellent reason to keep studying NfL and keep following at-risk people longitudinally, as the authors note. As we do so, we should be realistic about how long it will take to amass enough data to change the clinical picture: it took 12 years to observe these 9 onsets. To validate plasma NfL to the point where it could take on some role of criterion, primary endpoint, or trigger, would take observing many more onsets over many more years. No one wants to wait that long for a drug. We need a different plan for how we’ll get a drug approved. That’s why Sonia and I have been campaigning for PrP lowering to be a primary endpoint for pre-symptomatic trials of an antisense drug [Vallabh 2020a]. PrP is present in everyone’s CSF, regardless of mutation and regardless of time until disease onset, and it is stable over time in the absence of drug treatment [Vallabh 2020b]. Thus, you don’t end up with the problem that you screen out >90% of mutation carriers. That means we actually have enough people to run a trial. This is, and must remain, our plan for near-term pre-symptomatic trials. Within such trials, it’s possible that one or a few people will happen to be in a prodromal state of elevated NfL, and if so, it’s conceivable following NfL as a secondary endpoint, and seeing a change after drug treatment, could provide a supportive anecdote, one that will help convince people that the drug really works. Similarly, in symptomatic patients, plasma NfL could also serve as a secondary endpoint, while a clinical outcome such as survival or a cognitive or functional scale would probably be the primary endpoint.
That’s where I think we’re at today, and for the coming years in which I hope to see the first effective drug enter the clinic. I don’t believe that the authors of this study disagree, and I applaud their thoughtful and balanced conclusions. But we must be careful to guard against misinterpretation by people who only hear the punchline, because so much is at stake.
R code to reproduce the analyses in this post is available on GitHub.

About Eric Vallabh Minikel
Eric Vallabh Minikel is on a lifelong quest to prevent prion disease. He is a scientist based at the Broad Institute of MIT and Harvard.