Middling results for tofersen in SOD1 ALS
This blog post discusses results presented yesterday by Dr. Tim Miller from VALOR, a Phase III clinical trial of tofersen, an antisense oligonucleotide against SOD1, for ALS. Information sources for this blog post are as follows. You can read press releases from Biogen and Ionis. I was able to watch the presentation live with free registration here; the webcast is no longer available but at the time I watched it, that page said that a recorded version would be uploaded sometime later on. As of this morning, the slide deck is now freely available from Biogen’s website *without* any clickthrough requirement of attesting that you will not redistribute or reproduce the content; the slides do not contain “all rights reserved” or similar statements. Therefore, I believe that I am permitted to include screenshots of some of the slides in this blog post, and will do so below.
Yesterday, Dr. Tim Miller presented the topline results from VALOR, a Phase III clinical trial of tofersen, an antisense oligonucleotide against SOD1, for ALS. This blog post is an update on what these results mean for the prion disease community and the ASO that we are developing against PRNP.
The results from this study were perfectly middling. Tofersen did not achieve a statistically significant improvement over plcaebo on its primary endpoint, and there were some indicatons of serious adverse events in a handful of study participants who received tofersen. On the other hand, both the primary endpoint and all secondary endpoints trended in the right direction — that is, tofersen looked just a bit better than placebo — and this was especially true over longer follow-up in the open label extension trial.
I would have been really thrilled to see tofersen smash its primary endpoint, sail through to an uncontroversial approval, and transform the lives of SOD1 ALS patients. That’s not what happened. But, after the devastating failure of tominersen, a similar ASO against HTT for Huntington’s disease, in a Phase III trial earlier this year, “perfectly middling” is not such a bad outcome. I believe that there is both some potential, tentative good news in these trial results, as well as some interesting points for reflection and strategizing as we think about ASOs for prion disease and other programs going forward.
background and trial design
First, let’s back up for some context. Tofersen is an ASO designed to lower SOD1 mRNA and thus SOD1 protein. The idea of lowering SOD1 is a therapeutic hypothesis with good roots in human genetics, as a wide variety of SOD1 missense mutations cause ALS by a gain-of-function, causing SOD1 aggregates to accumulate in the spinal cord. SOD1 was one of, if not the, first CNS target explored for ASO therapy in preclinical models [Smith 2006], but an early human trial that used slow infusion of a SOD1 ASO [Miller 2013] did not achieve significant target engagement — that is, SOD1 did not appear to be lowered as hoped — and so was abandoned. A new generation of ASOs performed really well in animal models [McCampbell 2018] and one, tofersen, was advanced to human trials, a partnership between Ionis and Biogen. The new human trials used bolus dosing — each dose is given as a single quick intrathecal (into the lumbar spine) injection, rather than an infusion. In Phase I, tofersen lowered CSF SOD1 by 33% at the highest (100 mg) dose level [Miller 2020]. Moreover, while that Phase I trial was not designed to be powered for clinical or other biomarker endpoints, the data also showed a whiff of stabilization in ALSFRS-R, a clinical rating scale for ALS severity [Cedarbaum 1999], and of reduction in neurofilament light in both plasma and CSF, a marker of neuronal damage. Therefore tofersen was advanced to a Phase III trial, VALOR, (NCT02623699). As in the Phase I trial, the 100 mg dose was given starting with three loading doses two weeks apart, followed by one dose every four weeks (Q4W).
VALOR was designed to test whether tofersen slowed disease progression. The primary endpoint was that same rating scale, ALSFRS-R. According to clinicaltrials.gov, the trial enrolled 108 symptomatic ALS patients with SOD1 mutations. That’s a not-insignificant fraction of all the patients that exist. For a couple of comparators, the largest natural history study I could find [Bali 2017], collected details on just 175 SOD1 ALS patients in North America over 17 years, and one literature meta-analysis estimated 946 SOD1 ALS cases per year worldwide [Brown 2021]. Because all these patients have ALS caused by SOD1, in principle they could all stand to benefit from tofersen if it works, but there are some important differences among SOD1 mutations. Just like in prion disease, different SOD1 mutations are associated with different typical clinical courses: some mutations give rise to rapid disease and others to slow disease [Bali 2017]. SOD1 A4V, the most prevalent mutation, kills the average patient within 1.4 years, while other mutations take 5, 10, even 20+ years [Bali 2017]. When designing a clinical trial, one has to consider the different subtypes of disease that might be eligible, and there is often a tradeoff in terms of how broadly to recruit. On one hand, you might want to select the patients where you expect to most confidently and/or most quickly observe a drug’s hypothesized benefit, because then the trial has a higher probability of success and/or is shorter, and then the drug can be approved sooner and then many more patients can benefit. On the other hand, you might want the trial to enroll broadly, because then your trial provides evidence of efficacy across a wider patient population, and so the drug may ultimately be labeled, prescribed, and/or reimbursed for more patients. In VALOR, Biogen chose an “enriched” trial design, which is an option enshrined in FDA guidance [FDA 2019]. In an enriched trial design, you try to get relatively more of the patients you think are most likely to benefit from the drug, and/or most likely to decline quickly without the drug, without necessarily totally excluding other patients. You can imagine that in a disease that progresses gradually over 20+ years, as is the case for some ALS cases, proving that a drug makes disease progression even slower is going take an awfully long time. Therefore, Biogen sought to enrich for rapid ALS by choosing more patients with certain mutations, especially A4V. They figured that because these patients decline so rapidly on the ALSFRS-R scale, it would be possible to swiftly show that tofersen slows their decline. In the end, 60/108 patients in this trial had rapid mutations, and the other 48 had slow mutations. Many plots in this presentation were stratified by rapid vs. slow mutations, in red and blue respectively.
summary of results
With all that said, here is the main result, describing how the primary endpoint moved over the course of the trial:
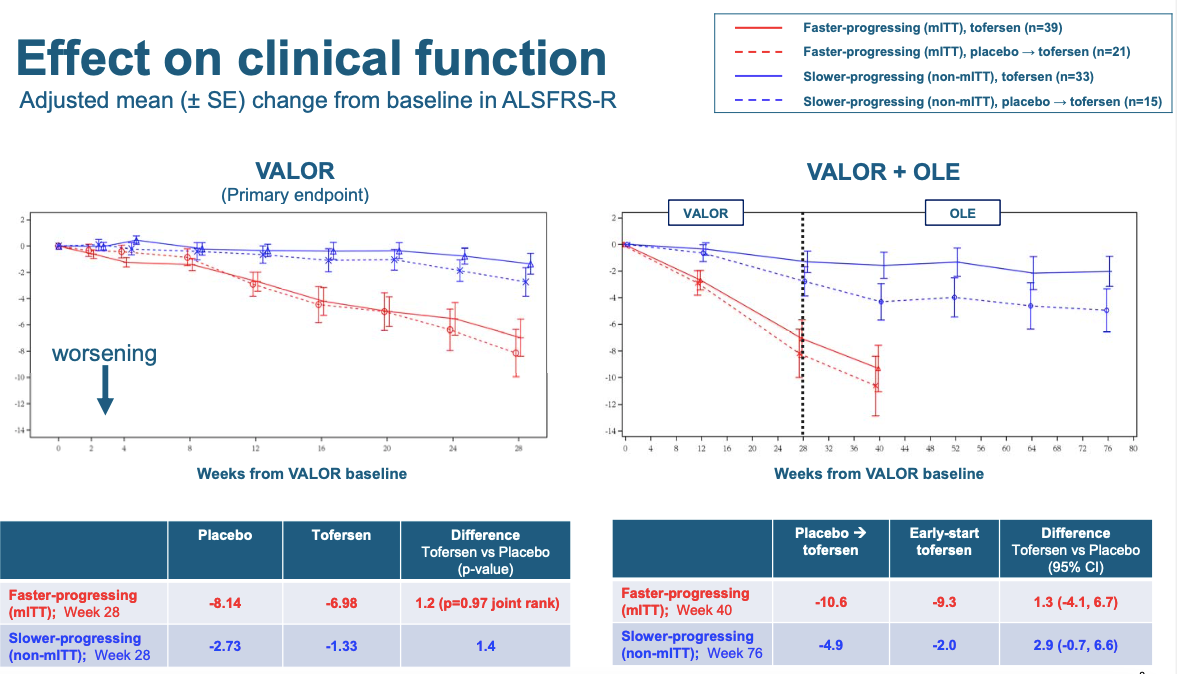
Your eyes are immediately drawn to the difference between the red and blue, but that’s just the rapid vs. slow mutations. The difference the trial was designed to detect is the much more subtle difference between the solid and dashed lines, which correspond to tofersen and placebo respectively. It’s a very small difference, but it trends in the right direction. Down is worse. ALS patients get worse over time. If anything, they got worse a little bit slower on tofersen than on placebo. How big a difference is this? The error bars in this plot are denoted as signifying mean±SE, which I take to mean, one standard error. Now, when I plot data, my convention is to plot error bars that are 95% confidence intervals, which means ±1.96SE, because 1.96 standard errors is 95% of a normal distributon. Thus if you assume normal distributions, then when two groups have error bars of ±1.96SE that do not overlap, that means the result is nominally statistically significant at P < 0.05. The 0.05 is just arbitrary, and many distributions are not normal, and many times one is looking at more than one statistical test, which should be corrected for, all important caveats. But I find that’s still a useful visual cue. In the above plots, this is not how the data are shown — instead, error bars are just one standard error. So now imagine the above plot but with all error bars about twice as long on each side. That would show you just how much uncertainty exists about whether the tofersen solid line is really higher than the placebo dashed line. And this is standard errors, not standard deviations — in other words, it’s not just that there is a lot of variability among patients, it’s that we can’t even be sure which average is better. The tofersen and placebo groups were really, really close. That’s why even though the figure looks pretty good visually, the P value in the table is 0.97. That said, while Biogen had to pre-specify its primary endpoint as being stratified by rapid vs. slow, you the reader don’t have to be so scrupulous, if you just want to get a best guess of whether tofersen worked. The fact that the slow and rapid groups have a similar trend is encouraging, and if I had access to the raw data, for my own curiosity I’d do some kind of normalized combined analysis across the two groups, and it still wouldn’t be significant, but it’d be better than 0.97. If your prior is skepticism, then these data won’t convince you, but if your prior was, SOD1 causes these people’s disease and so lowering SOD1 is probably going to do at least some good, the data might very slightly hint that yeah, maybe it did do some good.
Another thing you can appreciate from the above plot is how tall an order this trial endpoint was. If you imagine, again, the double-size error bars, you can see that the red solid line would have to stay almost perfectly flat at the zero in order for the double-size error bars to not overlap with those of the red dashed line. In other words, tofersen would have had to swiftly, and almost completely, arrest disease progression in rapid mutation individuals, in order for the result to end up significant at P < 0.05 by the 28-week mark. I am curious how that happened. The folks who designed the trial presumably did some modeling to project what effect size the trial would be powered to detect, and I wonder if the patients turned out more variable than they had assumed, or if SOD1 ALS is too rare to recruit enough patients to be better powered for small effects, or both.
The right hand plot includes the open label extension trial, in which people who had been on placebo switched to tofersen at week 28 (though they are still shown as a dashed line even after they switch). In the slow mutation group, the placebo people who switched to tofersen progressed for one additional data point and then appeared pretty flat, in other words, their disease did not progress much more over the subsequent year. This part of the trial was no longer randomized, so it’s hard to conclude anything for sure, but the fact that these people seemed to stabilize is, again, slightly encouraging.
ALSFRS-R is designed to include all different aspects of disability caused by ALS, so it’s perhaps not surprising that the results from several more specific disease metrics look similar. Measures of respiratory function (SVC), muscle strength (HHD), and particularly a patient-reported quality of life metric (ALSAQ-5 [Jenkinson & Fitzpatrick 2001]), all showed a similar non-significant trend towards being better on tofersen than on placebo. I won’t go into those in detail here.
In the open label extension, there was also a trend that people who got tofersen earlier (rather than placebo followed by tofersen) survived longer:
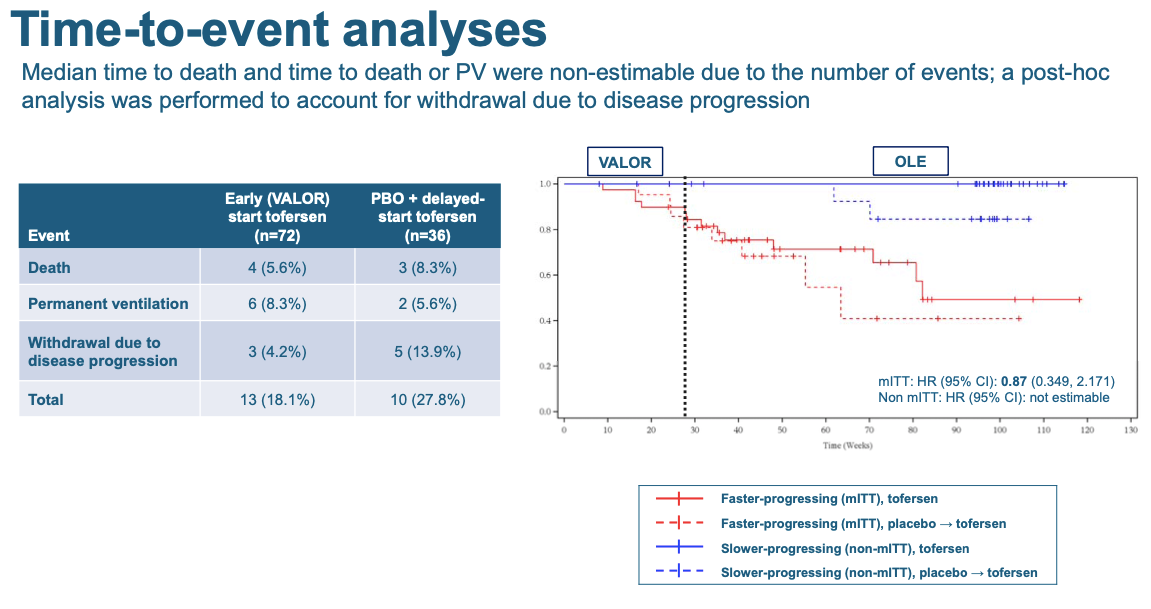
Each downtick in these curves is one patient dying, going permanently onto a ventilator, or withdrawing from the trial because their disease got too severe. Again, it’s not significant but the trend is in the right direction — the patients who got tofersen earlier, stayed alive longer.
Another secondary outcome is plasma neurofilament light, that biomarker of neuronal damage that had looked promising in the Phase I study. Here there was a larger difference, with lower NfL in the tofersen-treated people:
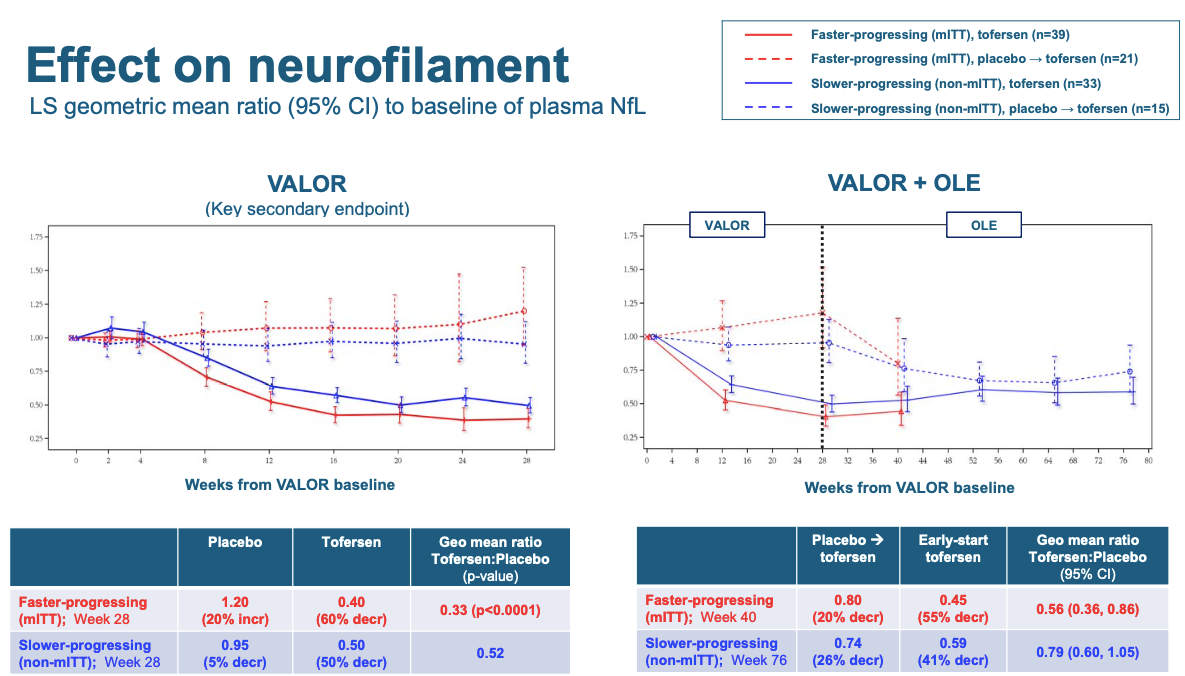
Note that in this plot, unlike the ALSFRS-R plot above, the error bars are denoted to signify 95% confidence intervals. Thus, where you see a dashed and solid line whose error bars don’t overlap, that means the result is nominally significant at P < 0.05. And for both the rapid and slow groups in the randomized phase of the trial (left panel), there is a lot of whitespace in the middle of the plot between the error bars. This shows you that the lowering of NfL in tofersen-treated individuals is very highly significant (the table below says P < 0.0001). That suggests that at a cellular level, at least, tofersen probably did do a lot to slow neurodegeneration. In the right panel, you see that even in the open label phase, people who switched to tofersen saw a subsequent decline in NfL. (The Twittersphere seemed most excited about the NfL result after the talk, and a decent chunk of Dr. Miller’s presentation focused on the question of whether maybe baseline NfL, and not rapid vs. slow mutation, should have been the original basis on which to stratify patients in this trial.)
As for safety, tofersen looked okay, but not excellent. 4 out of 72 patients on tofersen in the randomized phase of the trial had a serious neurologic event that was “treatment-emergent”:
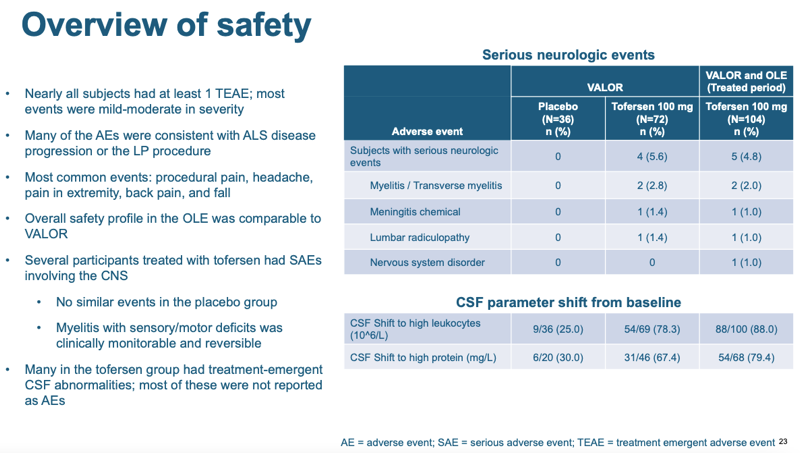
That’s not a statistically significant enrichment — compared to 0 in the placebo group I get a P value of 0.29 by a Fisher’s exact test. But those events might well be drug-related. Moreover, the majority of patients treated with tofersen had at least some kind of CSF abnormality detectable by a laboratory test (which did not rise to the level of a health issue): high white cell count and/or high total protein concentration. None of the four adverse events were fatal, and two (myelitis) were treatable. Overall it’s not great news, but it’s also not terrible news. In the scheme of how severe SOD1 ALS is, this level of safety issue is not a major setback.
A final piece of data that is worth sharing is the target engagement — lowering of SOD1 in CSF:
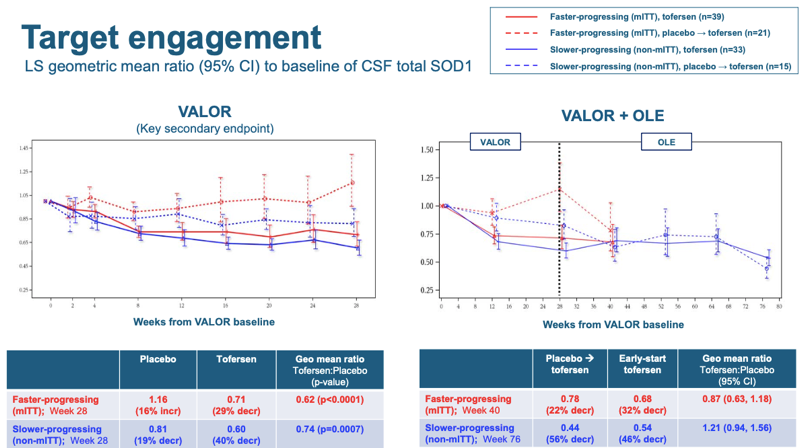
Here, it’s easier to look at the right hand panel, because the normalized starting point of 1.00 is labeled on the axis. You can see that once patients got tofersen (whether early in the randomized phase or later in the open label), their CSF SOD1 dropped by about 30-40%. Thus, target engagement in this study was pretty similar to the 33% observed for the same dosing regimen in Phase I [Miller 2020]. Two things to note. First, this is in contrast to the tominsersen results. For tominersen, 13 weeks of dosing in Phase I only yielded 40% knockdown of CSF mutant huntingtin (mHTT), whereas the same Q4W dosing regimen when continued over 15 months eventually yielded 77% knockdown, either due to biomarker lag or due to continued drug accumulation. But for tofersen, knockdown was pretty similar after 3 months or 15 months. Second, modeling work done in non-human primates suggests that CSF SOD1 probably underestimates the degree of knockdown in spinal cord — see Figure 5 panels A & C of [McCampbell 2018]. At the 35 mg dose in monkeys, SOD1 was lowered about 50% in CSF but about 75% in spinal cord, and at the 12 mg dose, it was lowered maybe 25% in CSF but about 50% in spinal cord. Thus, we might guess that 33% knockdown in CSF in patients in this trial probably corresponded to 50% or more reduction in the spinal cord, which is the most affected region in SOD1 ALS.
what’s next for tofersen
In the Q&A, people asked whether Biogen planned to file for FDA approval of tofersen based on these data, despite not having met the primary endpoint. Dr. Miller said he did not know and couldn’t speak for Biogen. He did note that in response to the trial results, Biogen was expanding its early access program (EAP), which allows compassionate use of tofersen in certain patients who qualify. I interpret that as a sign that Biogen views the results as positive and thinks that tofersen does indeed work. Though not mentioned in the talk, I also noticed on clinicaltrials.gov that there is already a trial, enrolling since April, of tofersen for presymptomatic SOD1 carriers (NCT04856982). Healthy asymptomatic patients will get a blood draw every 28 days, and if their NfL rises above some threshold (presmably a threshold believed to predict imminent disease onset), then they’ll be randomized to tofersen or placebo for two years to see if the drug can stave off disease onset.
why weren’t the results better?
I allow the possibility that the small effect seen for tofersen actually is — or will be, with more data — enough to get the drug approved. But putting myself in the shoes of the ALS community — not such different shoes from those here in the prion community — this certainly wasn’t the magnitude of result one most ardently hopes for. Patients on tofersen still declined, and died, at almost the same rate as those on placebo.
SOD1 causes ALS in these patients, and tofersen lowered SOD1. It also unambiguously lowered plasma NfL, which may provide evidence that it was slowing neurodgeneration as well. So why, then, was the clinical benefit of tofersen — if any — so small?
One can imagine a lot of possible explanations that I don’t have the data to dissect in any meaningful way. For instance, maybe lowering SOD1 had a relatively strong benefit, but the drug also had some on-target or off-target toxicity that partially masked that benefit, leaving only a smaller benefit to be observable. But two obvious variables I’d like to dive into in this blog post are potency and time.
Could more potent knockdown do better? As I just noted above, the monkey data suggest that ~33% knockdown of SOD1 in CSF might correspond to something more like 50% knockdown in the spinal cord, which should be what matters for SOD1 ALS. Would even deeper knockdown get us a larger clinical benefit? Intuition suggests yes, but it’s hard to be sure. There is some evidence from animals: when ASOs of different potencies were compared at the same dose level (300 μg) in a rat model, the two more potent new generation ASOs extended survival more than the less potent older ASO [McCampbell 2018]. But that’s a necessarily artificial transgenic system. In humans with just two gene copies, is there a risk of lowering SOD1 by too much? Maybe, it’s not clear. In animals, SOD1 knockout has a phenotype, but is not lethal [Reaume 1996]. In humans, there is a recessive syndrome associated with homozygous SOD1 truncating mutations [Andersen 2019, Park 2019], though I have heard some debate about whether it’s pure loss-of-function or also involves some gain-of-function component, as the mutant protein is still expressed. Whereas the human population data suggest that HTT is essential while PRNP is pretty dispensible, SOD1 is somewhere in between [Minikel 2020]: loss-of-function mutations are somewhat depleted from the general population. Thus, at present it’s not clear whether 50% knockdown of SOD1 is not enough, and if it’s not enough, does there exist a percentage knockdown that would be enough to arrest the disease, without causing a loss-of-function syndrome. Deeper knockdown of SOD1 is certainly one therapeutic hypothesis, and depending on how worried people are about loss-of-function side effects, it might lend itself to allele-specific knockdown.
Alternatively or in addition, could more time yield a better outcome? We can consider the chain of events that leads to impact on ALS progression. First, you have to reach active concentrations of drug, which here was achieved through loading doses over a month’s time. Along the way, the ASO has to become active, lowering SOD1 mRNA. This happens within 2 weeks of a single dose [McCampbell 2018], so it’s already well underway by the time the last loading dose is given. Once the RNA is lowered, the half-life of the protein will dictate how quickly it decays to a new steady state. One study found that SOD1 protein in brain was reduced just two weeks post-dose in rats [Winer 2013], albeit it may not quite have been at steady state yet: the RNA was reduced 69% while the protein was reduced just 48%. A more recent study using SILK found a longer half-life, which varied by tissue — for example, it was 16 days for wild-type SOD1 protein and 9 days for mutant SOD1 protein in rat spinal cord [Crisp 2015]. Then, you could ask, once the substrate of SOD1 protein is reduced, how long until the aggregates of mutant protein are cleared? That study actually found that the turnover of misfolded SOD1 aggregates was even faster than that of normal SOD1, just 2 days [Crisp 2015]. You could solve some differential equations to really model it out, but at a quick pass, a lower bound worst case is you just add the 4 weeks of loading doses, 2 weeks to maximal RNA target engagement, and generously add another 4 weeks for protein turnover, and within 10 weeks, you’ve reduced aggregated SOD1. That’s well within the 28 weeks that the VALOR trial. But then we get to the mysteries. How exactly does misfolded/aggregated SOD1 kill motor neurons? What secondary molecular pathologies does it touch off that take longer to resolve? And for how long do those pathologies have to be tamped down before the patient feels or functions better? We just don’t know. But the data may hint — and Dr. Miller pointed this out in the Q&A — that even after switching to tofersen, the placebo-treated individuals in the open label didn’t do as well as the people who got tofersen earlier on. “Either earlier or longer… has a greater effect,” he said. The trouble is, symptomatic patients with A4V just don’t have longer. Thus, if time is really the issue, then we have to put our hopes in the presymptomatic trial and bet that ALS is easier to prevent than it is to treat.
implications for our prion disease ASO
Overall the results for tofersen are neither spectacular, nor spectacularly bad. Some commentators speculated that Biogen would angle for Accelerated Approval of tofersen, but overall, the stock market seemed to feel that the chances of tofersen being approved had gone down, as Ionis’s stock took a 17% hit in the first two hours of this morning:
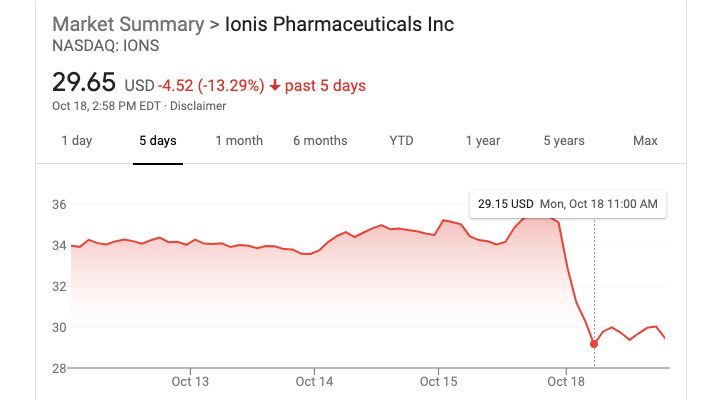
And from a patient perspective, whether or not the effect observed here is enough to get the drug approved, it’s certainly not the dramatic life-saving effect that ALS patients so desire.
Overall, I felt at least some sense of relief compared to the tominersen results from April. If tofersen had failed in a similar fashion, making patients worse rather than better, it would have been a relatively bad sign for other CNS ASO programs, including ours. Instead, tofersen appears to be reasonably tolerable, even if its safety record is not perfect, and shows some encouraging signs of maybe being effective, even though it’s a small effect at best and we can’t be sure whether it’s any effect at all.
When tominersen failed, I raised three questions about the implications of that failure for prion disease ASOs. It’s worth revisiting those now in light of the tofersen results.
First, how do these trials bode for other ASOs? In April, it seemed that tominersen’s failure could be either on-target (due to HTT lowering), off-target but pretty specific to tominersen, or off-target with some toxic liability shared by some appreciable fraction of ASOs. The new data make me lean slightly more towards the first two options. Tofersen had some safety issues but overall it did not seem to make patients worse. And that’s despite the fact that patients in VALOR were sick, sometimes very sick, somewhat arguing against the possibility of a disease stage-specific liability.
Second, how do these trial results affect the prospects for using ASOs to prevent vs. treat neurodegenerative disease? For tominersen, I argued it could push either way, on one hand motivating earlier intervention but on the other hand making people more cautious about putting a risky drug into still-healthy people. The tofersen data probably push more towards the prevention end. To the extent that there exists any efficacy signal in these data, albeit subtle and speculative, the hint is that earlier and longer treatment helps more. But the tofersen prevention trial will tell us a lot more.
Third, how do these trial results affect the potential duration or size of future ASO trials? I argued tominersen might push for larger longer trials, because the ill effects of tominersen were not obvious in 13 weeks and emerged only after 17 months. Tofersen, on one hand, showed similar target engagement over 3 months vs. 15 months, and no truly glaring safety signals or exacerbation of disease emerged in the longer timeframe. Thus, these new data may not do too much to raise regulators’ caution around short trials. On the other hand, if Dr. Miller is right that “earlier and longer” is better, then real opportunity to show clinical benefit in a trial may lie in prevention or in treating more slowly progressive subtypes over a longer timeframe, so the companies designing the trials may feel compelled towards longer study designs anyway.
Looking forward, unfortunately, it may be a frustratingly long time until we know much more. The next two Phase III trials of CNS ASOs that I’m aware of have study completion dates in 2024: FUS in ALS (NCT04768972) and GFAP in Alexander disease (NCT04849741). The tofersen prevention trial (NCT04856982) has a completion date in 2026. Until these milestones, our next insights about CNS ASOs in humans may simply come from deeper analyses of the data from tominersen and tofersen. As Dr. Miller said in his remarks, this is a new dataset, and we haven’t asked all the questions we want to yet.
Update June 7, 2022
Biogen has now released longer-term follow-up data from the open label extension phase of the trial, see press release and slide deck. The new analysis follows patients for a total of 12 months, comparing people who started on tofersen to those who were started on placebo and then transitioned to tofersen after 6 months, controlling for baseline NfL rather than mutation. The new analysis shows nominally significant differences between these “early tofersen” and “delayed tofersen” groups on ALSFRS-R, respiratory strength, muscle strength, and survival. The ALSFRS-R plot is below.
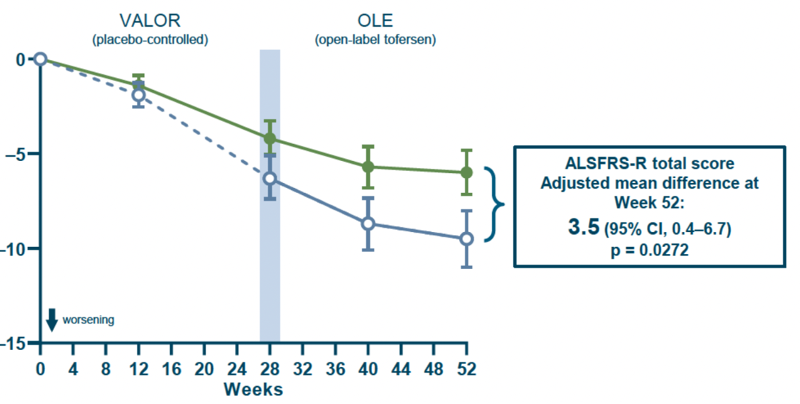
Overall these findings appear to provide some encouraging supportive data suggesting that tofersen might have a beneficial effect, just over a longer time window than the trial was originally designed to accommodate.

About Eric Vallabh Minikel
Eric Vallabh Minikel is on a lifelong quest to prevent prion disease. He is a scientist based at the Broad Institute of MIT and Harvard.