Allele-specific RNA-seq pipeline using Gsnap and GATK
motivation
I have some mRNA-seq data I’ve aligned with Gsnap, called expression levels (FPKMs) using Cufflinks, QCed and done a traditional gene expression analysis on. Then a very specific question came up: is one allele of huntingtin (HTT) more highly expressed than the other? We hadn’t originally set out to do genome-wide allele-specific gene expression and have not genotyped all of the individuals included in the RNA-seq samples. But we do know the HTT haplotypes for all of these individuals, so I figured it should be simple enough to figure out if one allele was overrepresented.
I Googled “allele-specific RNA-seq” and found an assortment of relevant tools such as AlleleSeq and asSeq, and relevant papers [e.g. Skelly 2011, Stevenson 2013]. However what I really needed was a simple, flexible Unix pipeline that could help me figure out how to use basic tools to answer my specific question even though I don’t have separate genome-wide SNP data. I didn’t find that, so here it is.
Major disclaimer: this is not a comprehensive pipeline for doing a full-on allele-specific analysis. It’s just a few steps to let you calculate the allelic balance at SNPs of interest based on your RNA-seq data. Depending on your needs, it might be enough, and if you neither have large n nor have previously haplotyped your samples, it might be just about all you can do.
overview
The basic idea here is to align FASTQ reads with Gsnap and then call SNPs with GATK, producing a VCF which you’ll analyze in R. (You’ll also need samtools for some intermediate steps).
GATK, unlike samtools mpileup, lists the reference and alternate allelic depths (AD) in the VCFs it produces, which is a very useful thing indeed. After you call SNPs you can look in the VCF for SNPs you’re interested in and see if the allelic balance departs from 50/50. Be warned that unless you have a lot of SNPs and a lot of samples, or a case of pretty extreme allele-specific expression, it’s going to be fairly hard to figure out if any AD differences represent a biological difference or just chance variation.
step 1. prep the GATK reference for Gsnap
GATK is finnicky. In fact, the folks behind GATK have actively engineered it to not work with any reference genome FASTA files that aren’t sorted in GATK’s preferred order, an approach they themselves describe as “draconian”. To get GATK to call SNPs on your RNA-seq data, your safest bet is to align against the reference in GATK’s own resource bundle, available on Broad’s GSA server.
As of today the latest bundle version is 2.5 and I’m using hg19, so the files I need are here: ftp://gsapubftp-anonymous@ftp.broadinstitute.org/bundle/2.5/hg19/
To download, md5 it and gunzip it all in Unix (borrowed from my exome pipeline):
wget -r ftp://gsapubftp-anonymous@ftp.broadinstitute.org/bundle/2.5/hg19/ # download all files in this directory
ls *.md5 | awk '{print "sed -i \x27s|/humgen/gsa-scr1/pub/bundle/2.5/hg19/||\x27 " $0}' | bash  # replace the absolute paths in all the md5 files
ls *.md5 | awk '{print "md5sum -c " $0}' | bash # check all the md5sums - if any are not 'OK' then stop here.
gunzip *.gz
And then use gmap_build to create a Gsnap index on this reference (see README for instructions):
gmap_build -d hg19_gatk -k 15 -s none gatk-bundle-2.5-hg19/ucsc.hg19.fasta
This took about 20 minutes.
It is incredibly important that you include the -s none parameter, which turns off sorting. Otherwise Gsnap will re-sort the chromosomes in the reference, thus causing GATK to later refuse to process the BAMs created by Gsnap.
After you run this command, you’ll find the directory in which you ran it curiously devoid of any newly-created Gsnap index. That’s because Gsnap puts indices in its own database directory, not the directory where you run the command. Gsnap doesn’t seem to have a command for finding out what this directory is, but if all goes smoothly you won’t need to find it anyway.
step 2 (optional). subset your reads
This pipeline should work fine on whole FASTQs. But in my case I’d already aligned my reads once – just not to a GATK-compatible reference. So I needed to realign, but I knew I only cared about allele-specific expression for one gene, HTT, located at chr4:3076408-3245687. If you have similar needs, you can save a LOT of time by only looking at the region of interest and not the whole genome.
I subsetted my already-aligned BAMs with samtools view and decomposed the (paired-end) BAMs back to (single-end) FASTQs with a modified version of this brute-force command line approach:
for i in {01..24}
do
    samtools view srtd/MGH$i.bam chr4:3076408-3245687 | awk 'NR%2==1 {print "@"$1"_1\n"$10"\n+\n"$11}' > $outdir/MGH$i.fastq
    samtools view srtd/MGH$i.bam chr4:3076408-3245687 | awk 'NR%2==0 {print "@"$1"_2\n"$10"\n+\n"$11}' >> $outdir/MGH$i.fastq
done
This took just a few seconds per each of my 24 samples (note that the input BAMs do have to already be sorted and indexed). This gave me one ~2-3MB FASTQ per sample, as opposed to the several GB paired-end FASTQs I’d started with. This makes the downstream steps run in seconds rather than hours.
step 3. align with Gsnap
Now that you’ve got FASTQs and an indexed reference for Gsnap, you’re ready to align. I align into SAM format and pipe the output directly to samtools view for compression, then use samtools sort and index since GATK will require this for the next step.
for i in {01..24}
do
    gsnap --format=sam --read-group-id=RGUNKNOWN --read-group-name=MGH$i --read-group-library=LBUNKNOWN --read-group-platform=illumina -N 1 -m 10 -d hg19_gatk $outdir/MGH$i.fastq | samtools view -Sbh - > MGH$i.bam
    samtools sort MGH$i.bam MGH$i.srtd
    samtools index MGH$i.srtd.bam
done
This took about 1 or 2 minutes per sample. Remember I’m working with very small files though. When I’ve previously run Gsnap on 40M pairs of 50bp reads, it’s taken about 100 hours.
Note the use of -d hg19_gatk to specify the reference index we just created in step 1. -N 1 specifies “yes, do look for novel splice sites” and -m 10 specifies a maximum of 10 mismatches. I’m not enough of an RNA-seq expert to comment on whether these are necessarily the right settings to use, that’s just what I have in my pipeline for now.
step 4. call SNPs with GATK
Now it’s time to pile up the 24 BAMs I created in the last step and joint call variants on all of them using GATK’s UnifiedGenotyper.
java -jar /data/talkowski/tools/local/src/GenomeAnalysisTK-2.4-9-g532efad/GenomeAnalysisTK.jar \
   -R /data/HD/dataset/gatk-bundle-2.5-hg19/ucsc.hg19.fasta \
   -T UnifiedGenotyper \
   -I MGH01.srtd.bam -I MGH02.srtd.bam -I MGH03.srtd.bam -I MGH04.srtd.bam -I MGH05.srtd.bam -I MGH06.srtd.bam -I MGH07.srtd.bam -I MGH08.srtd.bam -I MGH09.srtd.bam -I MGH10.srtd.bam -I MGH11.srtd.bam -I MGH12.srtd.bam -I  -I MGH13.srtd.bam -I MGH14.srtd.bam -I MGH15.srtd.bam -I MGH16.srtd.bam -I MGH17.srtd.bam -I MGH18.srtd.bam -I MGH19.srtd.bam -I MGH20.srtd.bam -I MGH21.srtd.bam -I MGH22.srtd.bam -I MGH23.srtd.bam -I MGH24.srtd.bam \
   -L chr4:3076408-3245687 \
   --dbsnp /data/HD/dataset/gatk-bundle-2.5-hg19/dbsnp_137.hg19.vcf \
   -o all.htt.vcf \
   -stand_call_conf 50.0 \
   -stand_emit_conf 10.0 \
   -U ALLOW_N_CIGAR_READS
This ran in just a few minutes. Some notes:
-Rspecifies the FASTA reference genome. This has to be the exact same file you used to create the Gsnap index in step 1.-Ilists the BAM files to pile up. If your BAMs are numbered sequentially like mine, then you can generate a list like this with a loop something like this:for i in {01..24}; do echo -n "-I MGH$i.srtd.bam "; done-Lspecifies the genomic region in which to call variants, chosen here to match the range I subsetted into my BAMs. Even if you’ve subsetted your BAMs, using -L still speeds up UnifiedGenotyper by a factor of 10 or 100. If you don’t do this, GATK will waste time looking at regions where no BAMs even have coverage. Even if you’re doing genome-wide SNPs and not just one gene, you might consider specifying a bed file of known transcripts or known exons.--dbsnpspecifies the dbsnp file in the same resource bundle where we got the reference genome FASTA file. If you specify this, you’ll get dbSNP ids (rsids) for the SNPs that GATK calls.- UPDATE 2014-01-22: Added
-U ALLOW_N_CIGAR_READSto allow this command line to work with newer GATK versions which check for N in CIGAR strings. Not sure if this is the best way to handle this; there are two options, according to the below error message which I got when I ran GATK without this:##### ERROR MESSAGE: Unsupported CIGAR operator N in read H7452ADXX130828:1:1211:19750:84317 at 1:30027. Perhaps you are trying to use RNA-Seq data? While we are currently actively working to support this data type unfortunately the GATK cannot be used with this data in its current form. You have the option of either filtering out all reads with operator N in their CIGAR string (please add --filter_reads_with_N_cigar to your command line) or assume the risk of processing those reads as they are including the pertinent unsafe flag (please add -U ALLOW_N_CIGAR_READS to your command line). Notice however that if you were to choose the latter, an unspecified subset of the analytical outputs of an unspecified subset of the tools will become unpredictable. Consequently the GATK team might well not be able to provide you with the usual support with any issue regarding any output
step 5. analysis
At this point you’ve got a VCF file, in my case all.htt.vcf, with variant calls in your region of interest for all of your samples. Most of these variant calls will be extremely low quality, for two reasons.
First, though the libraries submitted for mRNA-seq are supposed to be enriched for mRNAs via polyA selection (or ribozero depletion of rRNA and so on), some amount of immature pre-mRNA usually creeps in. That means that you’ll get, say, 100x coverage of exons but you’ll also still get 5x or 10x coverage of introns. Introns make up most of the gene and (at least in HTT, where evolution seems to have tolerated almost no variation at all in the coding sequence) an even larger fraction of the SNPs. Yet your 5x or 10x coverage of introns is not deep enough to reliably call SNPs.
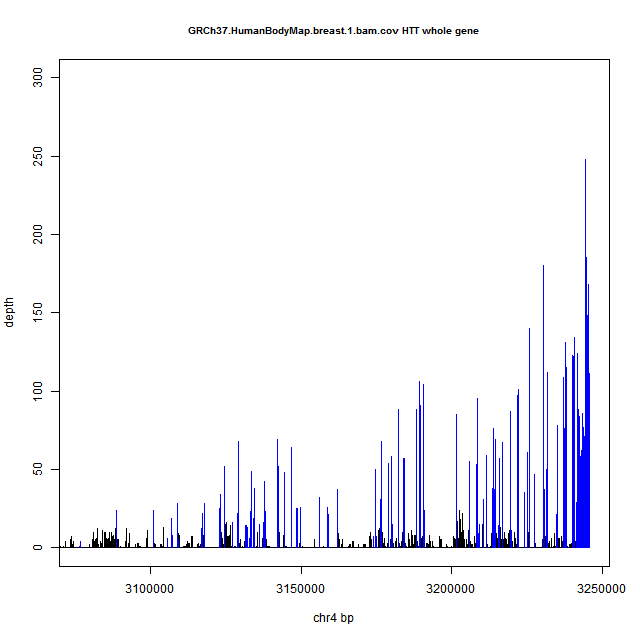
Second, RNA degrades quickly, and so polyA selection may catch the 3′ end of an mRNA that’s already breaking down, meaning some portion of the 5′ end has already been lost. As a result, mRNA-seq coverage (at least when polyA selection protocols have been used) is deeper at the 3′ end of genes and can get pretty sparse at the 5′.
As an example of both of these phenomena, here’s a coverage plot of HTT in human breast tissue from Human BodyMap 2.0. Exons are in blue and introns in black. Note the ~250x coverage at the 3′UTR (far right) trailing off to ~10x by the time you get to the 5′UTR (far left), and the variable coverage of introns in black between the blue spikes of exonic coverage.
For both of these reasons, it’s probably unwise to do any analysis on the full set of SNPs that you get out of GATK. The QUAL field gives the PHRED-scaled probability of there not actually being a SNP in any sample at each site, so P(no actual SNP here) = 1 – 1/QUAL, i.e. QUAL = 10,000 means 99.99% certainty there’s really a SNP. See description of VCF fields. You could filter on QUAL, or FILTER, or you could just use known SNPs of interest. I’ll present here an approach in R using the QUAL field.
In this approach I cast the VCF to a matrix, melt it into relational form with three columns (dbSNP id, sample id, and value) and then use sapply and strsplit to parse the value field to yield allelic depth (AD) for the ref and alt alleles. A weakness of this code is that it’s very difficult to make the sapply/strsplit combination robust to invalid values. GATK leaves the value field as simply ./. for uncalled genotypes, which makes strsplit throw errors, but these functions have no equivalent of na.rm, and the solutions I found online – this, this and this – don’t work for this specific use case. Therefore I just had to play around with the QUAL threshold until I set it high enough that, for every variant meeting that threshold, all 24 of my samples had a genotype call. If you have hundreds of samples, this approach might not work for you without some modification – I welcome any suggestions.
First I removed the extraneous header information from the VCF in bash and changed #CHROM to CHROM to make the column names R-friendly:
cat all.htt.vcf | grep -v ^## | sed 's/^#CHROM/CHROM/' > headerless.vcf
Then I ran this R script:
# cat all.htt.vcf | grep -v ^## | sed 's/^#CHROM/CHROM/' > headerless.vcf

library(reshape) # for melt
options(stringsAsFactors=FALSE)
setwd('c:/sci/026rplcl/data/rna/allele-spec/')

qual_threshold = 3000 # for me this was the lowest I could set it without including any no-call genotypes
vcf = read.table('headerless.vcf',header=TRUE)
dim(vcf[vcf$QUAL > qual_threshold, 1:9]) # check the number of remaining SNPs after filtering

mat = as.matrix(vcf[vcf$QUAL > qual_threshold, 10:33]) # cast the value portion of the VCF to a matrix
dim(mat)
rownames(mat) = vcf$ID[vcf$QUAL > qual_threshold] # re-apply the row names

rel = melt(mat) # melt matrix to a 3-column relational table
dim(rel)
colnames(rel) = c("ID","SAMPLE","VALUE")

rel$AD = sapply(strsplit(rel$VALUE,":"),"[[",2) # parse allelic depth (AD) from value field
rel$REFAD = as.integer(sapply(strsplit(rel$AD,","),"[[",1)) # parse REF allele depth from AD
rel$ALTAD = as.integer(sapply(strsplit(rel$AD,","),"[[",2)) # parse ALT allele depth from AD
rel$ARATIO = rel$ALTAD / (rel$REFAD + rel$ALTAD) # calculate allelic ratio (% reads supporting ALT allele)

rel$BP = as.integer(vcf$POS[match(rel$ID,vcf$ID)])
plot(rel$BP, rel$ARATIO, pch=19, xlab='chr4 BP', ylab='ALT allele depth as fraction of total', main='Allelic balance at HTT SNPs')
abline(h=.5)
The result is a plot like this, showing the allelic balance for the various samples at each variant site.
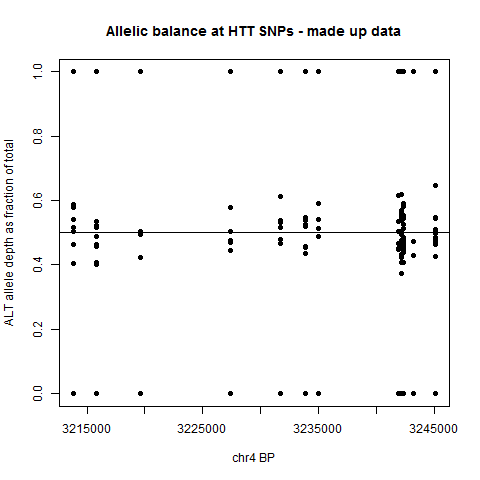
This by itself probably isn’t that informative, since it doesn’t reflect phasing – the y axis is always the percentage of the ALT allele, even though a person’s ALT allele at one SNP may be on the opposite haplotype as their ALT allele at another SNP. But at least, this sort of plot is a first glance at the data and may help you decide how far to pursue this – if the allelic balance of every SNP is very tightly clustered around 50/50, odds are against you finding any interesting allele-specific patterns. If the spread is larger and worth looking into, then how you do the downstream analysis will depend on how you have got your haplotype data structured.
That’s all I’ve got – this isn’t the right way to do allele-specific expression, but if your dataset’s already been created and the question is just whether you can answer a specific question with it, hopefully this will be helpful.

About Eric Vallabh Minikel
Eric Vallabh Minikel is on a lifelong quest to prevent prion disease. He is a scientist based at the Broad Institute of MIT and Harvard.