Literature review: image segmentation on H&E-stained tissue samples
In several recent posts [1][2][3][4], I have discussed how to accurately segment in vivo mouse brain sections stained with hematoxylin and eosin, as a first step toward automatedly distinguishing FFI from wild-type samples. After playing with it enough myself to get a sense of what the challenges are, I return to the motivation for every good literature review: surely someone else has already figured this out!
In this case the answer appears to be: sort of. There is indeed a lot of literature out there on segmenting these sorts of images, and a few of the studies boast fairly high accuracy rates. But most are pretty complex custom software jobs, with a wide variety of different approaches employed and variable degrees of success, so on the whole my read is that it’s not exactly a solved problem.
Today’s top Google hit for “image segmentation hematoxylin eosin” is Glotsos 2004 [citation][full text]:
Glotsos D, Spyridonos P, Cavouras D, Ravazoula P, Dadioti PA, Nikiforidis G. 2004. Automated segmentation of routinely hematoxylin-eosin-stained microscopic images by combining support vector machine clustering and active contour models. Anal Quant Cytol Histol. 26(6):331-40.
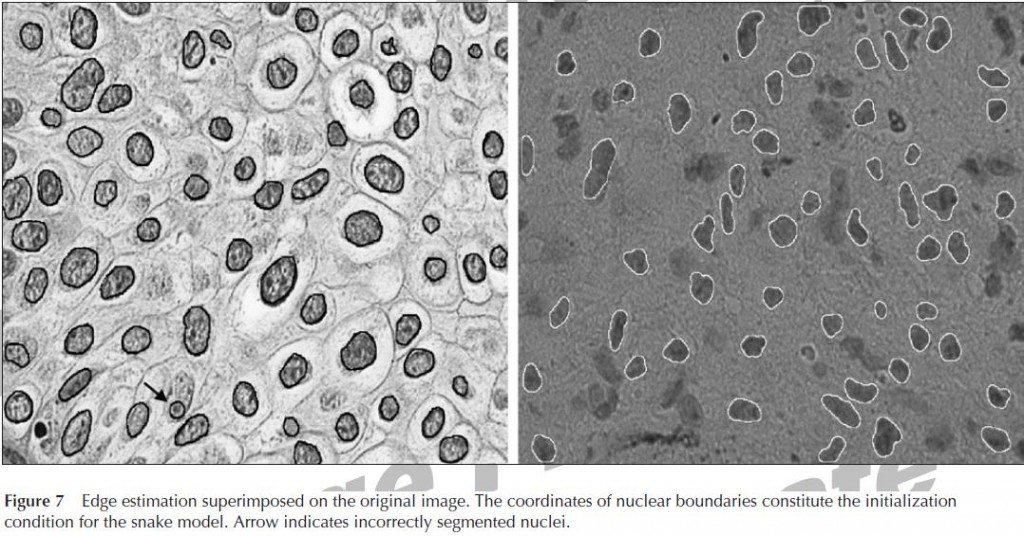
These folks use a support vector machine clustering (SVMC) algorthm to coarsely classify pixels as nucleus vs. non-nucleus and then an active contour model aka “snake” to find the edge of each object. The edge is deemed to occur where the “snake’s” energy is minimized, with energy defined according to a series of equations that Glotsos et al provide. The oddest thing about this paper, to my mind, is that they chose to segment grayscale images, with the RGB channels simply averaged as far as I can tell, rather than taking advantage of the color difference between hematoxylin and eosin. Another thing I find a bit peculiar is that the authors do have access to manual segmentations created by experts as a ground truth, but use them solely for scoring their final output. The approach described in this paper is not a machine learning approach per se, since the algorithm does not have the benefit of the human input to learn from. The authors state that 94% of nuclei identified in the ground truth were correctly segmented by their algorithm. But in the example images they show (see Figure 7 below), there are a lot of other dark blobs, not identified by the algorithm, that really look to my inexpert eye like nuclei. I’d like to know if those aren’t nuclei then what are they, and I’d like to hear some discussion of how awesomely the algorithm was able to identify only the same nuclei that the experts marked up the ground truth while managing to ignore all the other, very similar-looking, dark blobs.
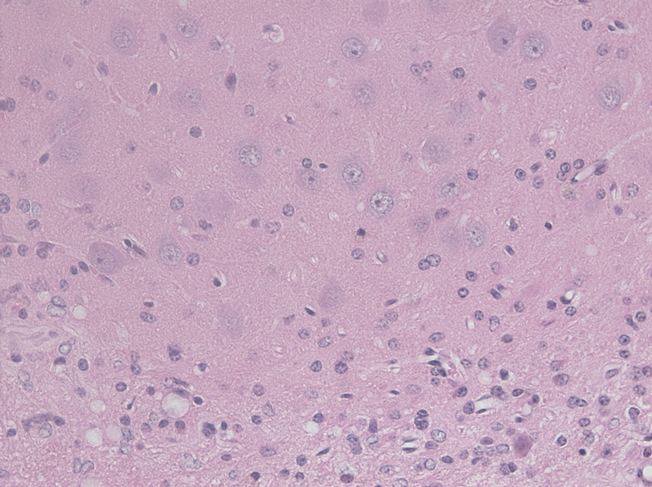
I bring up this last point because it is a major issue with in vivo sections: sometimes you have different cell types or object types in the same field of view. This is certainly true in the mouse brain images I’m working with (example below), where ideally it would be nice to segment blood vessels, vacuoles, neuron nuclei and astrocyte nuclei.
This is a real challenge because these objects are all of different colors, sizes and intensities, so it’s tough to find an algorithm that will recognize them all in one go; yet if you try to find four different algorithms, one for each object type, then the neuron algorithm will have a tough time ignoring the much more darkly stained astrocytes. It looks to me like Glotsos et al don’t have quite the same problem I do; I see pretty much uniform cell types in both of the types of tumor they examine. But if there is some reason why they are purposefully ignoring the other dark blobs that aren’t outlined in Figure 7, then perhaps their images aren’t that different from mine after all.
In Glotsos et al’s own lit review, they point to no fewer than five distinct approaches to fully automated image segmentation on H&E images:
- histogram-based techniques
- edge-detection methods
- region-based algorithms
- pattern recognition approaches
- active contour models
and they discuss the pitfalls of each.
On the other hand, Kong and Gurcan, who I blogged about last time, have a pretty different focus [citation]…
Kong H, Gurcan M, Belkacem-Boussaid K. 2011. Partitioning Histopathological Images: An Integrated Framework for Supervised Color-Texture Segmentation and Cell Splitting. IEEE Trans Med Imaging 30(1):1661-1677
In contrast to Glotsos, who uses grayscale images without so much as a note about what happened to the color, Kong’s paper is focused primarily on the color transformations employed to make the images more segmentable. Kong’s approach also employs ground truth information from the start– it’s easy to miss if you read quickly, but in Section III-A, Kong talks about creating the training patches to teach the algorithm what a nucleus looks like and what the background looks like: “From each of the five transformed images, we manually mark 150 locations in the nuclei and extra-cellular regions, respectively. An 11×11 local neighborhood at each marked location is cropped as a training image patch.”
Kong et al calculate their own algorithm’s segmentation accuracy with their most discriminant color (MDC) space to be 76.9% (see Table III, p. 1672). But they are using a very different metric of accuracy than Glotsos. Kong’s accuracy metric is introduced as follows:
For each compared algorithm, we get a black and white (binary) image whose white pixels correspond to the cell-nuclei regions. Let A be the binary image produced by our method and B be the ground-truth mask, the cell-nuclei segmentation accuracy can be computed as ACC = (A∩B)/(A∪B).
This scoring algorithm would reach 1.0 when A = B and 0 when A and B are disjoint. So the scale is different, but in principle this is no different than what Jain calls “pixel error” and describes thus: “A naive method of evaluation is to count the number of pixels on which the computer boundary labelings disagree with the human boundary labeling”. Jain, along with others in the Seung lab, prefer to score using the Rand index as it appropriately penalizes mergers and splits, rewarding algorithms that can split touching or clumped cells.
Even though it’s not especially rewarded by the scoring method employed, Kong does do some very fancy stuff with concavity detection in order to split touching and clumped cells and seems to get fairly good results with that.
Another high Google hit for this subject area is the 2010 work of Tosun et al [full text]:
Tosun, AB, Sokmensuer, C, Gunduz-Demir, C. 2010. Unsupervised Tissue Image Segmentation through Object-Oriented Texture. IEEE DOI 10.1109/ICPR.2010.616
I haven’t read this one in as much detail. It’s solving a fairly different problem– you’ll notice at a glance that their images are at a much lesser zoom level than mine, or Glotsos’s or Kong’s. Their focus is not as much on individual nuclei as on identifying regions of tissue within which texture and/or cell type are uniform. I may come back to this in the future though–perhaps their approach could be used to identify the thalamus, etc. brain regions in the mouse samples I’m working with. And the Allen Institute’s mouse brain images have regions already identified, which would be a nice ground truth to work with.
All three of the papers above are dealing with cancers. I wondered whether anyone had image segmentation on H&E-stained brain tissue samples and whether there might be anything more specifically relevant to my cause there. A few different Google searches didn’t reveal much: I found nothing dealing with neurodegenerative diseases, but I did find that Glotsos et al have a paper on astrocytomas from 2005 [citation][full text]:
Glotsos D, Tohka J, Ravazoula P, Cavouras D, Nikiforidis G. 2005. Automated diagnosis of brain tumours astrocytomas using probabilistic neural network clustering and support vector machines. Int J Neural Syst. 15(1-2):1-11.
As in the other paper, Glotsos uses support vector machines, this time paired with a probabilistic neural network. The goal is to classify H&E-stained images of astrocytomas into grade II, II-III, II and IV tumors. In spite of the authors’ relatively strong success at segmentation in this paper, one quote is still a reminder of how much human intuition and expertise still goes into a lot of machine-based classification studies: ”For each biopsy, the histopathologist specified the most representative region. From this region… images were acquired” In other words, experts picked out the regions of tissue to image for the study.
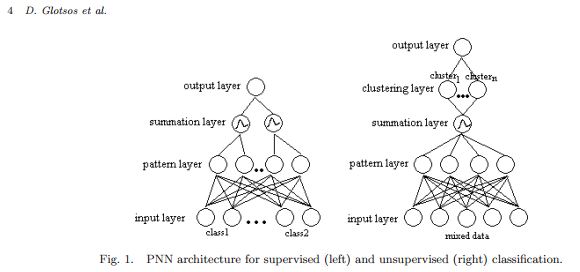
In terms of segmentation ground truth, though, this study used an expert’s segmentation only for testing, not for training, the segmentation algorithm. The segmentation approach was to calculate a number of different features for each pixel having to do with autocorrelation, spread and cross-relation and then feed these features into a probabilistic neural network (Fig 1, below). It seems like a pretty different approach from the convolutional network I’ve discussed here previously [1][2][3], though, as it does not seem to be “learning” from a ground truth and feeding back in on itself.
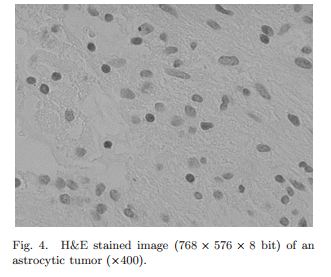
It looks like the images they are working with (from the one example they show, anyway, Fig 4 below) do NOT have the peculiarity that my mouse brain images have, of multiple object types in the same field. I see only astrocytes in this image:
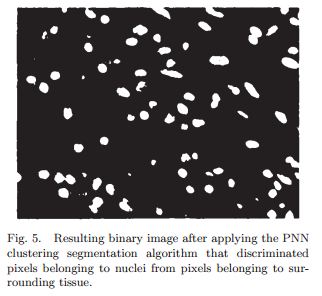
After initial segmentation, they use “morphological filters, size filters and fill holes operations” to further clean up the binary image. It makes a big difference, as you can see from the difference between Fig 5 and Fig 6 below. These are operations I will probably have to learn the hang of sooner or later.
As with Glotsos’ 2004 paper, this one uses grayscale images and makes no mention of color whatsoever (Ctrl-F and you’ll find that the phrase “Leica DC 300 F color video camera” contains the only instance of the word “color” in the whole paper).
So, having found a few papers on H&E image segmentation for cancer, one for a brain cancer, and none for neurodegenerative disease, my final question was, has anyone done H&E image segmentation with CellProfiler? After all, CellProfiler has that UnmixColors module with preset values for H&E, so presumably people have fed their images into CellProfiler and maybe as a next step they used IdentifyPrimaryObjects?
A bit of Googling revealed that Damon Cargol and Richard Frock at University of Washington have shared images and a pipeline for segmenting H&E-stained muscle tissue to one of CellProfiler’s forums. Now, that was in 2008, so the pipeline is a .mat file for CellProfiler 1.0, which was implemented in Matlab. Since it’s binary I can’t open it in a text editor, but CellProfiler 2.0 has pretty good back-compatibility. It’s able to at least load the pipeline and show me what’s there, though it throws errors for the MeasureImageAreaOccupied and DisplayDataOnImage modules. Though it won’t work without some fixing of the broken things, I saved CP 2.0 version of the pipeline and uploaded it here (change the extension from .txt back to .cp once you download it). As far as I can tell, they’re just doing some illumination correction and then going straight into IdentifyPrimaryObjects, with settings as follows (same in Cargol’s original and Mark Bray’s modified version):
IdentifyPrimaryObjects:[module_num:7|svn_version:\'10826\'|variable_revision_number:8|show_window:True|notes:\x5B\x5D]
    Select the input image:InvertedGray
    Name the primary objects to be identified:Nuclei
    Typical diameter of objects, in pixel units (Min,Max):4,35
    Discard objects outside the diameter range?:Yes
    Try to merge too small objects with nearby larger objects?:Yes
    Discard objects touching the border of the image?:No
    Select the thresholding method:Otsu Global
    Threshold correction factor:1
    Lower and upper bounds on threshold:0,1
    Approximate fraction of image covered by objects?:0.01
    Method to distinguish clumped objects:Intensity
    Method to draw dividing lines between clumped objects:Intensity
    Size of smoothing filter:10
    Suppress local maxima that are closer than this minimum allowed distance:5
    Speed up by using lower-resolution image to find local maxima?:Yes
    Name the outline image:NucOutlines
    Fill holes in identified objects?:Yes
    Automatically calculate size of smoothing filter?:Yes
    Automatically calculate minimum allowed distance between local maxima?:Yes
    Manual threshold:0.0
    Select binary image:Otsu Global
    Retain outlines of the identified objects?:Yes
    Automatically calculate the threshold using the Otsu method?:Yes
    Enter Laplacian of Gaussian threshold:.5
    Two-class or three-class thresholding?:Two classes
    Minimize the weighted variance or the entropy?:Weighted variance
    Assign pixels in the middle intensity class to the foreground or the background?:Foreground
    Automatically calculate the size of objects for the Laplacian of Gaussian filter?:Yes
    Enter LoG filter diameter:5
    Handling of objects if excessive number of objects identified:Continue
    Maximum number of objects:500
    Select the measurement to threshold with:None
These settings differ from the defaults for IdentifyPrimaryObjects in exactly three settings: (1) diameter of objects is set to 4 to 35 (instead of 10 to 40), and (2) “try to merge too small objects with nearby larger objects” is checked, and (3) “discard objects touching the border of the image” is unchecked.
So what gives? I’ve spent weeks trying to get CellProfiler to segment my images, but these University of Washington people created a pipeline that segments H&E muscle tissue by just clicking a few buttons? Here are a few lessons from this pipeline that might be applicable to getting my own segmentation to work better:
- Illumination correction. I have a hard time believing the magic is all in that (and my images look, to my naked eye at least, to be pretty evenly illuminated to start with) but since it’s the only other special thing they’re doing that I haven’t tried, I’ll give it a shot.
- Zoom level. See this sample image for instance (all the uploads related to this pipeline are here). It’s much more zoomed out than what I’m working with. Perhaps there’s a secret there. My images have so much detailed texture that it’s easy for a segmentation algorithm to get confused. I obviously don’t want to downsample, but I could introduce a Gaussian blur to abstract away much of the texture and make the nuclei look more like solid balls, like they do when they’re just a handful of pixels each.
- Object types. As with the other studies I discussed above, these researchers have the benefit of just looking at one kind of nucleus. My images aren’t that simple, but maybe there are things I can do with contrast enhancement to make the particular features I’m interested in really pop while fading the others out.
(This is one Jun Kong, not the same Hui Kong from earlier in this post). Kong has a fairly complicated approach involving first a color transformation, then a mean shift clustering procedure (MCSP), then background normalization, then contour regulation using gradient vector flow (this appears to be a variation on active contour models, see discussion here), then clumped object splitting using a watershed method. The performance of the algorithm is scored using several different metrics, one of which is the same metric that Hui Kong used above, which these authors dub “intersection to union ratio” or I2UR.
To hear Kong’s discussion of scoring metrics and comparison to CellProfiler on p. 6608, it really sounds as though the segmentation is so good that it’s down to a matter of who got the edges more correct. For instance they introduce Centroid Distance as one measure of segmentation accuracy, meaning the distance between the centroids of the objects as drawn by humans and by the algorithm. And in Figure 4 they show the differences in boundaries up close. This all sounds very advanced. Are we to believe that the algorithm (and the performance of CellProfiler for that matter) are so good that the question of cell count, of just finding the nuclei in the first place need not even bear mention? I’m not sure. Table I gives an I2UR of 72% which strikes me as maybe a bit worse than you’d get if it was all just a question of boundaries. I’d like to see a comparison of cell count in the ground truth, Kong’s algorithm and CellProfiler.
Of course, I’d also like to see the source code and, where applicable, the CellProfiler pipelines, for all of the studies discussed in this post. It’s a shame that none of them seem to be available, at least not anywhere I can find. (Kudos to Cargol and Frock at UW for uploading theirs). Nonetheless, this lit review has been helpful to point me in a few directions I can explore.
