Clinical laboratory tests: what's in a number?
The other day, I noticed a very small miracle. The kind which happens nearly every day, but always beneath our notice. Sonia and I attended a neurology grand rounds where someone was presenting a case report on a patient who eventually turned out to have prion disease. One of the first slides introducing the case showed a table of very routine clinical lab results from the first encounter with the patient, long before prion disease was suspected. Very routine stuff: complete blood counts, creatinine, alkaline phosphatase, hemoglobin A1c, and so on. The very small miracle is simply the following: the presenter waved her hand at the numbers on screen, indicated that all results were normal, and moved on. No one asked “what assay was used to measure this?” or “were the proper positive and negative controls included on the same plate?” or “what was the coefficient of variation between technical replicates?”. People looked at the numbers and those numbers meant something. With each year of my career, I realize more and more what a monumental achievement that actually is.
Why is this so amazing? Most things in biology ultimately boil down to counts of things — even if you measure concentration, that’s moles per liter, and a mole is just 6.02 × 10²³ molecules. But while we can directly count cells, we can’t directly count molecules, and so the readout from molecular assays is necessarily indirect. What you actually measure is often either the absorbance or emission of light of a particular wavelength, or the intensity of molecules striking an ion detector. Translating that number into a count of molecules is really, really hard. This CDC manual describes how plasma LDL, that most routine biomarker of cardiovascular disease risk, is measured. Ultimately you’re just trying to count how many low-density cholesterol particles there are per unit volume of blood. Doing so is actually monstrously complicated. First you measure total cholesterol by putting some plasma through a series of three chemical reactions that ultimately yield a product that absorbs light at 500 nm. Then you measure triglycerides by putting another aliquot of plasma through a different series of four chemical reactions that yield a different product that absorbs at 500 nm. Then you measure HDL by putting a third aliquot of plasma through yet four other reactions to yield a product that absorbs at 600 nm. Then you subtract HDL and 1/5 of triglycerides from total cholesterol to get LDL. The kits required to perform the assays are comprised of a total of 38 ingredients, and the instructions regarding sample handling, instrument calibration procedures, and quality control checks last more than 10 pages. The net result of this exacting specification is that even if LDL is measured in different years, at different hospitals, then without knowing any other details (except maybe whether it’s fasting) and without even remembering the units, one can say that 75 is “great” while 150 is “on the high side”. Humans were not born being able to quantify molecules like this. It’s actually an enormous scientific investment to be able to produce numbers that mean something.
Often in biology, we count molecules indirectly by measuring how much light of a particular wavelength is absorbed.
If the final protocol for an assay seems monstrously complicated, the process of developing that protocol is exponentially moreso. Most things in biology follow sigmoid curves. 0 molecules and 1,000 molecules both translate into no light absorbed. 1015 and 1018 molecules both translate into maximal light absorbed. Thus, at both the low and the high end, the assay is useless. In between, there exists some linear range where, say, 108 molecules translates into 1 unit of light absorbed while 109 molecules translates into 2 units of light absorbed. That’s the range where the results are actually meaningful. Developing an assay means fine-tuning the concentrations of myriad different inputs so that this dynamic range lines up with the range of values you expect to see in your samples. All while working to convince yourself that there are no interferences, no other molecules in some samples that might cause them to absorb light for a reason that has nothing to do with the molecule you’re interested in. Even then, what if one outlier sample is too high and maxes out the light absorbance you can measure? Can you go back and dilute the sample and re-run it, or does the process of dilution itself change the answer you get out? Developing a protocol that is robust against all these edge cases, where 75 means 75 and 150 means 150, is years of work.
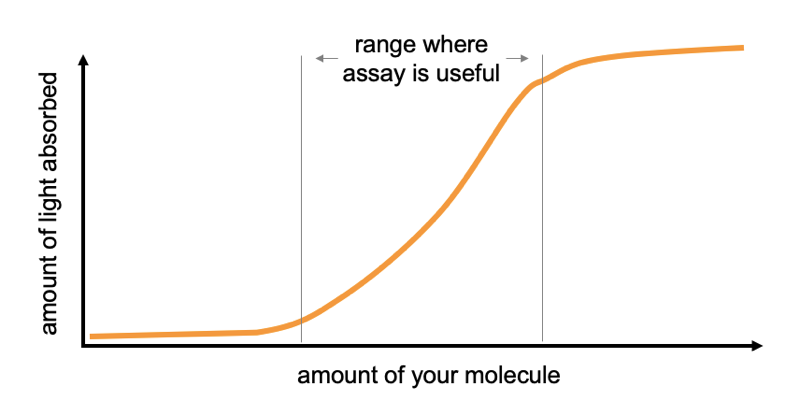
Many things in biology follow a sigmoid curve.
My gradual realization of all this has been a result of our lab’s long journey to quantify prion protein (PrP). If you’re just tuning in now, we’re on a personal mission to develop a drug for prion disease, and lowering the amount of PrP in the brain will work: it has great genetic proofs of concept and we’ve found that PrP-lowering antisense oligos work in prion-infected animals. In people who are at risk, we want to prevent disease altogether, and so we want to lower PrP before the disease ever starts. If we can measure PrP and show that a drug lowered it, that could be a potential path to getting a drug provisionally approved [Vallabh 2020a]. So for us, being able to quantify PrP is really important. Important, and not easy.
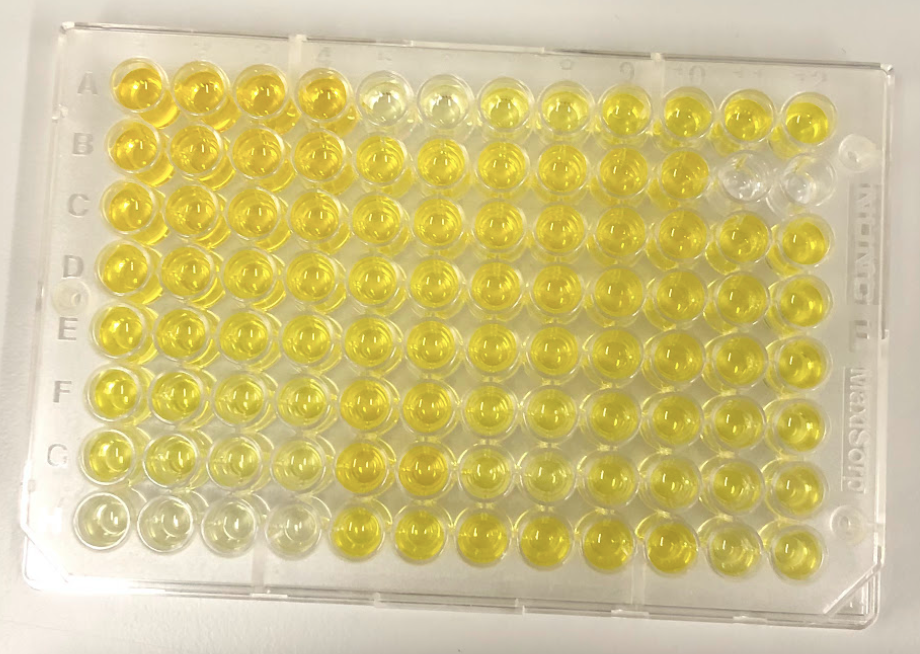
In some ways we were lucky: there is a lot of PrP in the brain, and it is extracellular and can be released from the cell membrane, so it’s very abundant in cerebrospinal fluid (CSF). We don’t need an ultra-sensitive single molecule counting assay to measure it. Just regular-old sandwich ELISA — 1990s technology where one antibody is stuck to a plate and the other is stuck to an enzyme that creates a colorimetric readout, and they grab your protein in between — is good enough to measure our protein of interest.
But in other ways we were unlucky. Our initial realization that we needed to figure out how to measure PrP came in 2016, while our antisense project was getting off the ground. We bought a commercially available PrP ELISA kit, BetaPrion, and started testing CSF samples that collaborators shared with us. We quickly found that one sample of CSF concentration might contain 2 nanograms per milliliter (ng/mL) of PrP, while another would contain 500 ng/mL. There was seemingly no rhyme or reason: the same person’s spinal fluid might be a 75 today and a 150 tomorrow. If our analyte varied by this much randomly, how on Earth would we ever be able to convince ourselves — and regulators and insurers and prescribers — that a drug had lowered it? But after noticing that differently sized aliquots of the same sample read out at different concentrations, we did a battery of “stability” experiments to see what would affect PrP concentration, and found that the biggest culprit was how much plastic the fluid was exposed to. The more plastic, the more PrP stuck to that plastic, and the less of it you could measure. We eventually convinced ourselves that most of this hundred-fold variability between samples was just “pre-analytical” — how the spinal fluid samples were handled before they ever came to be analyzed [Vallabh 2019].
We developed our own incredibly finnicky protocol for how spinal fluid should be handled in order to keep PrP from being lost to plastic. With that in hand, we were relieved to see that in our cohort study at Mass General Hospital, when the same person underwent a lumbar puncture months or even years apart, their spinal fluid would turn out to have almost the exact same PrP concentration over and over [Vallabh 2020b]. All was not lost after all. If we could lower PrP with a drug, we should be able to measure that lowered concentration in spinal fluid.
But all the while, we were still using that BetaPrion kit, and while it was good enough to answer a lot of our questions, it wasn’t perfect. When we produced recombinant PrP in our lab, and then measured it on the plate, our own “2 ng/mL” read out about four times higher than the kit’s “2 ng/mL” standard. And we didn’t love the amount of variability we saw between plates, or even from the upper left corner to the bottom right corner of the same plate. At most, it seemed that the kit was giving us relative PrP concentrations, not absolute ones, and even then, to be confident of the relative values between two samples, you ideally wanted to run the two samples side by side, this one in wells A1 and A2 and that sample in wells A3 and A4. In other words, if one sample reads out as 75 and another reads out as 150, you still have to waste a lot of breath explaining the controls that make you confident that those numbers are meaningfully different, or the caveats that make you worry the numbers are not meaningfully different. When we met with FDA in a Pre-IND meeting on Halloween 2019, Dr. Ashutosh Rao, the biomarker expert in the room, told us that this was not an acceptable state of affairs if we wanted to use the assay clinically. Over time, I’ve come to appreciate more and more how much that’s the case: in a clinical trial you want to analyze samples in real time to know how to set doses and even whether to continue the trial. Yet you also need the first and last sample collected to be comparable so that you can still analyze the whole dataset together at the end. 75 has to mean something different from 150.
We had already developed a targeted mass spectrometry assay for PrP [Minikel & Kuhn 2019], but it was expensive and labor-intensive. Plus not many contract research organizations (CROs) could implement it. (Neither drug companies nor academic labs normally analyze samples from clinical trials — they are sent out to contractors that do everything to a T and have no skin in the game.) We needed a simple, easy assay that anyone could do. And while we were at it, ideally we needed the assay to work across a variety of animals used in preclinical drug discovery (BetaPrion is human-specific), so that we could use the same method to measure PrP in a mouse, a rat, a monkey, and a human.
Today, finally, after years of effort, we have an assay to tell you about — and a lot of results from it too [Mortberg 2021]. Prion Alliance started by hiring a CRO (Cambridge Biomedical, since acquired by Bioagilytix) to develop an assay. They screened antibody pairs and established a first set of working conditions. They then came to Broad and trained us to run the assay, and Meredith Mortberg, in our lab, spent months and months tweaking assay conditions, validating the assay, and optimizing conditions for sample preparation, all before she even got on to analyzing any actual samples of interest. This assay is now a crucial core tool in our lab that we use for everything. It can measure PrP in brain homogenate or in spinal fluid, across at least six different species of interest for prion research, with one overnight incubation and about a day’s work. It took a couple years of work just to have this working assay in hand, and of course, all that work is boiled down to just one paragraph in the main text of the new paper [Mortberg 2021], with all other details relegated to the supplementary materials.
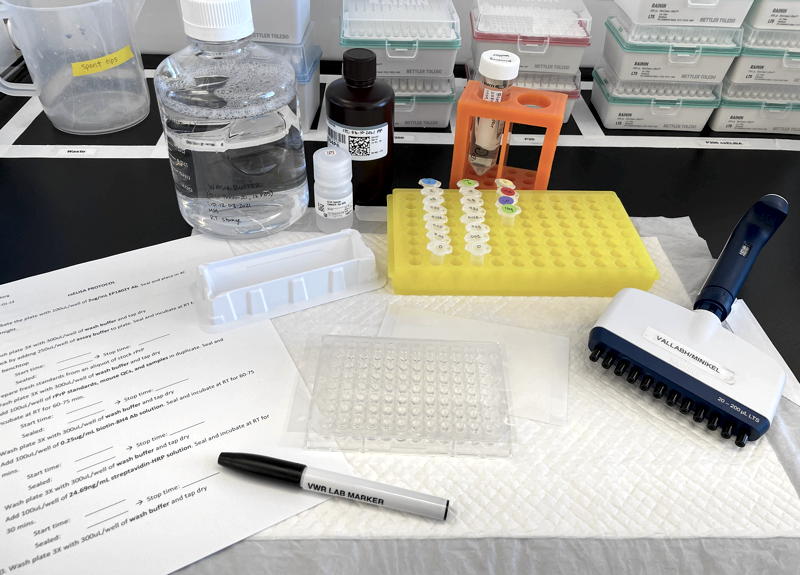
Supplies and reagents set up for our in-house, cross-species PrP ELISA.
Most of the new paper is devoted to what we’ve done with the assay to probe basic questions about PrP and about PrP lowering therapy. We found that PrP concentration varies dramatically — about an order of magnitude — between different brain regions. People always ask what triggers prion disease — why does it suddenly strike in mid-life when you’ve had the mutation since birth? — and we thought, we might as well check, does PrP expression rise with age? No, not as far as we can tell. There’s a slight sex bias in prion disease (1.2:1 male:female) and we wondered, do men express more PrP? No, not as far as we can tell. But here’s an interesting twist: even though PrP mutations cause disease by a gain of toxic function, some of them actually result in lower PrP concentration in CSF. People who are heterozygous for D178N have just 31% as much CSF PrP as wild-type individuals. Less than half, which makes us wonder, does the presence of the mutation not only lower expression of mutant PrP, but also of the wild-type PrP from the other allele? We’d seen a whiff of this before with BetaPrion [Vallabh 2020b], but couldn’t be sure it wasn’t an artifact (e.g. if one of the BetaPrion antibodies couldn’t detect D178N PrP) — now that we’ve seen it with both ELISA assays and with mass spec, we’re certain it’s real. And it’s not just that one mutation: we also found that heterozygosity for P102L results in just 55% the CSF PrP concentration of wild-type individuals. One implication of this, we argue, is that therapeutic benefit of a drug is more likely to be predicted by a person’s change in PrP concentration from their own baseline, rather than some absolute cutoff. If CSF PrP averages about 70 ng/mL in wild-type individuals and if one were to set a treamtent goal of getting people down below 30 ng/mL of PrP, well, plenty of D178N mutation carriers are already below that threshold, and yet they’re at very high lifetime risk of developing prion disease.
Most importantly for our therapeutic program, we’ve finally validated a link we long assumed was there, but didn’t have evidence for until now. We treated mice and rats with antisense oligos and measured the relationship between the target RNA, protein in the brain, and protein in spinal fluid. Thankfully the answer was as hoped: lowering of RNA is reflected in the amount of PrP in the brain, and in turn, in the amount of PrP in CSF. If you thought we already knew that, it’s probably because Sonia and I have long assumed it. That’s not to say we took it for granted, just that we had to make certain temporary assumptions in order to move forward, and our whole program kind of depended on being able to read out PrP lowering in CSF. But the truth is, we didn’t have any hard evidence to point to until now. If the answer had gone the other way, it would have been kind of a hiccup, to say the least.
It’s rare for an academic lab to spend so much of its effort on methods development to quantify one single analyte. But it’s also rare for one single analyte to be as pivotal to a drug development strategy as PrP is to ours. When I look back over our last five years of quantifying PrP, it’s amazing how far we’ve come. From seeing no rhyme or reason to the hundred-fold variability we saw in those first samples in 2016, we now understand a lot of factors that impact quantification of PrP, and we have a valuable tool in hand to do it. We’re now good enough at quantifying PrP that we can see it move in a beautiful dose-response when we titrate the amount of antisense oligo injected into an animal, and this gives us hope that we can do the same in human beings.
For all that, when I look at that CDC manual on quantifying LDL, I remember just how high a mountain we are trying to climb. If we wanted to be able say someone’s PrP was 150 before treatment, and 75 after treatment, are we there yet? Yes and no. Our assay passed nearly all the metrics that FDA looks for in bioanalytical method validation. But its variability is still a bit high between plates at the low end. We aren’t a “good laboratory practices” (GLP) lab, and so we didn’t validate the assay according to the level of formality that is required for clinical assays, which means there could be things we missed. One of the antibodies we use is stored at 4°C, and we didn’t evaluate whether one batch would hold up at -80°C if you needed to stockpile it for years of clinical trial sample analysis. For the time being, this is not a clinically validated assay. It’s a tool, and a darn good one we plan to use the heck out of. One more step up towards the drug development mountaintop.

About Eric Vallabh Minikel
Eric Vallabh Minikel is on a lifelong quest to prevent prion disease. He is a scientist based at the Broad Institute of MIT and Harvard.