A look at PrP knockdown screen data
introduction
Exactly two years ago I set out to analyze the data from some high-throughput screens for small molecules to reduce PrP levels in cells. At the time, I got a short ways into the analysis before getting daunted and setting it aside. Now that I’m in the Schreiber lab, with access to some excellent cheminformatic mentorship, and now that I’ve been doing more thinking about strategies to deplete PrP, I decided it was time to take another look at these data. This post a preliminary, very exploratory peek at these data, which may or may not be followed up by another post depending on what feedback I get in conversations with people about this topic. All the R code for this post is in this GitHub repo.
the screens
Here is a summary of the three high-throughput screens for small molecules to reduce PrP levels that we know of:
| 1 | 2 | 3 | |
|---|---|---|---|
| PI | Jack Rogers | Corinne Lasmezas | Stanley Prusiner |
| institution | Harvard Medical School | Scripps Florida | UCSF |
| year | 2010 | 2013 | 2014 |
| measured outcome | PRNP 5’UTR activity | cell surface PrP | total PrP |
| cell line | H4 cells, a commercially available human neuroglioma cell line | LD9 cells, which are a subclone of the commercially available L929 mouse fibroblast line | T98G human glioblastoma and IMR32 human neuroblastoma cell lines |
| approach | Expressed the 5’UTR of human PRNP mRNA fused to a luciferase open reading frame, looked for reductions in luciferase signal | FRET assay with antibodies against PrP’s N terminus (SAF32) and C terminus (D18) so that proximity is only achieved if PrP is present | ELISA for total PrP using in-house HuM-P antibody |
| compound source | MLPCN | MLPCN | ChemBridge |
| N compounds | 335,011 | 370,726 | 44,578 |
| positive control | strophanthidin | brefeldin A | siRNA? |
| reference | PubChem BioAssay 488894 | PubChem BioAssay 720640, plus published pilot screen of US Drug Collection [Karapetyan & Sferrazza 2013] | PubChem BioAssay 1072100 (validated hits only) and [Silber 2014] |
I’ll refer to them, respectively, as the 5’UTR screen, the cell surface PrP screen, and the total PrP screen — though as you can see above, there are a lot of other differences between them. We don’t have the raw data for the total PrP screen, only the structures of 34 hits that were validated and subjected to dose response and appear in Table 3 of [Silber 2014]. So I’ll mainly be analyzing the 5’UTR and cell surface PrP screen, with occasional cross-referencing to things in the total PrP screen.
As for the current status of these efforts: as far as I can tell, the 5’UTR screen was totally abandoned years ago. There has been no update on the total PrP hits from the Prusiner lab for nearly two years, so I don’t know if any of those are under further development. On a recent teleconference held by CJD Foundation (September 29, 2015), Corinne Lasmezas stated that development of the cell surface PrP hits at Scripps is ongoing: “we have performed a new high-throughput screening with a larger library of compounds, and we have identified new molecules that we are developing into drugs right now.”
cytotoxicity data
All three of these screens are loss-of-signal screens — you’re looking for compounds that reduce the photons emitted by luciferase or by a fluorophore-conjugated antibody. As I’ve opined here, this poses obvious sources of false positives: you’ll pick up anything that, say, kills the cells, globally depresses translation, or prevents protein maturation in the ER (heck, brefeldin A, which does just that, was used as a positive control in the cell surface PrP screen).
An imperfect, but still helpful, way to rule out these sorts of mechanisms is to do a cytotoxicity counterscreen. They did this in [Silber 2014], but no such counterscreens were done for the 5’UTR or cell surface PrP screens, so I looked around for a cytotoxicity screen of the entire MLPCN library. (For background, MLPCN was an NIH contract funding mechanism to discover new small molecule probes, so the same library was screened in hundreds of different assays nationwide, including these two). By searching PubChem for “MLPCN cytotoxicity” I found two assays: BioAssay 1486, for cytotoxicity in the IEC-6 rat intestinal epithelial cell line, and BioAssay 1825, for cytotoxicity in the Ba/F3 mouse cell line. This Ba/F3 screen was done in 2009, and later, in 2012, it was announced that this cell line had been contaminated, so people who thought they were using Ba/F3 were actually using a different mouse cell line. For our purposes in this blog post, this doesn’t really matter. Indeed, if only they’d been contaminated with HeLa cells instead, then we’d actually have MLPCN library cytotoxicity data in human cells. A few limitations of these cytotoxicity screens: they’re in rodent cell lines, they were done in the earlier MLPCN days, circa 2009, so they only have about 290,000 compounds, and the compounds were incubated with cells for only 48 hours, so we’re also only going to see fairly acute toxic mechanisms, not things that take several days to develop. According to the raw data in the .csv files, the screens were done at 5.0 and 5.6 μM, which strikes me as a reasonable concentration for cytotoxicity screening. In any event, these two assays were the best cytotoxicity data I could find for this compound library.
The outcome from these assays is a percent growth inhibition, with compounds above 21.9 or 26.6% inhibition being called ‘Active’, or cytotoxic. I was a bit surprised how poorly the percent inhibition values in the two cell lines with one another: Pearson’s ρ = 0.37. So I took the max of the inhibition between the two screens and called anything above 20% inhibition toxic, which was 1.9% of the compounds in those screens.
5’UTR screen
The PubChem data for the 5’UTR screen already have hits labeled as ‘Active’ and a number of confirmatory screens and counterscreens. I wanted to take best advantage of those data, while also not limiting myself to what was originally called a hit. The nice thing about the 5’UTR screen is that nearly the exact same assay was also run with two other 5’UTRs fused to luciferase, namely those of APP and SNCA. These offer sort of built-in counterscreens to remove any compounds that just inhibit translation initiation on all, or even many, 5’UTRs, not to mention luciferase inhibitors, and all other manner of false positives. As far as I could tell, those other screens were not used in the original hit-calling process for the PRNP 5’UTR, so I set out to re-call hits.
All of the 5’UTR assays have an ‘activity score’ that is described as just a ‘calculated percent activity’. It’s not clear what exactly this was measuring, so I just Z-scored it, and then truncated the Z score distribution over a support of [-5,5]. I then plotted the Z scores for PRNP against those of SNCA and APP:
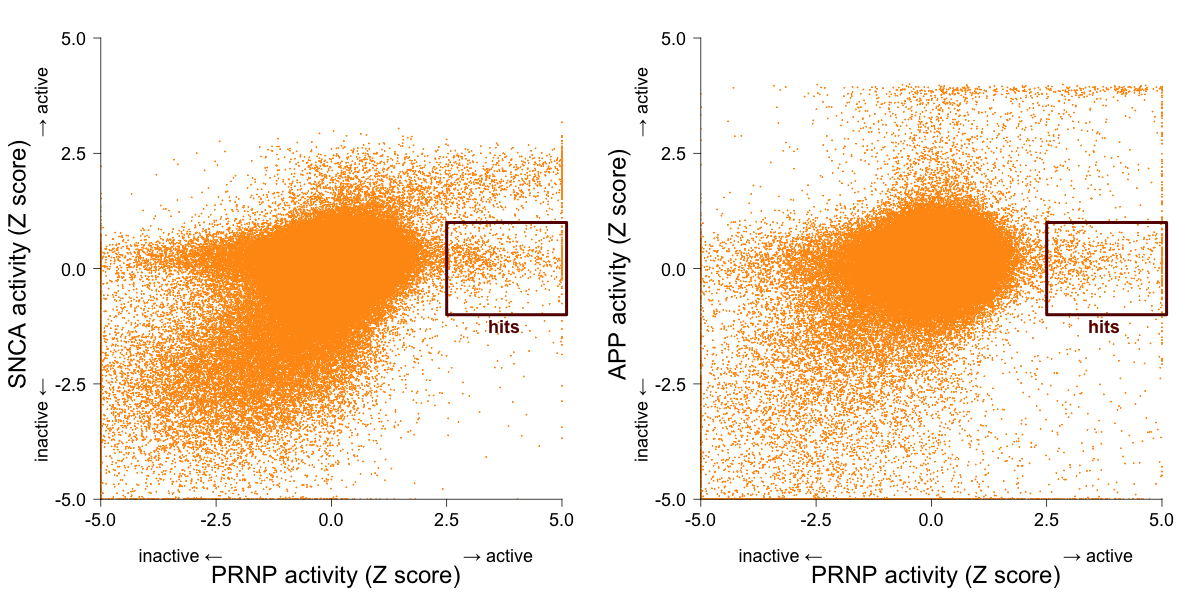
I’ve labeled the axes as stretching from “inactive” to “active”, but another way to think of it is that the truly inactive compounds are actually the ones in the middle; the compounds far to the bottom or left are actually increasing the number of photons detected — maybe they increase translation initiation, or are autofluorescent. Molecules that inhibit luciferase, globally depress translation, or kill cells should be in the upper right. The compounds of interest to me are those that considerably reduce luciferase signal expression from the PRNP 5’UTR (Z > 2.5), but have no effect one way or the other on the SNCA or APP 5’UTRs (|Z| < 1), labeled above as hits.
These scatterplots naturally show only those compounds that are actually shared between the pairs of screens. But in fact, of the 335,011 compounds in the PRNP screen, 88% were screened against SNCA, and only 56% were screened against APP. 89% were screened against at least one of these two other targets. I decided that the presence of these counterscreens was sufficiently important that I was willing to just toss out the 11% that had only ever been screened against PRNP. So my criteria for hit calling would be:
- Z > 2.5 for PRNP
- Screened against at least one of SNCA and APP
- |Z| < 1 for SNCA if screened
- |Z| < 1 for APP if screened
With this initial set of hits, I then filtered against all the other counterscreens for this particular project, plus the cytotoxicity data (above). For these I was less strict, only requiring that if the compound was tested, then it had to pass. Here’s how the numbers sifted out:
| step | N |
|---|---|
| Unique compounds tested against PRNP 5’UTR | 335011 |
| Also tested against SNCA and/or APP 5’UTR | 299129 |
| PRNP active but SNCA and/or APP inactive | 1257 |
| Inter-replicate reproducibility > 0.95 | 1234 |
| Non-toxic (if tested) in Ba/F3 & IEC6 cells | 1136 |
| Not found to be luciferase inhibitors | 1134 |
| Active (if tested) in PRNP dose-response | 1129 |
| Active (if tested) in 2.5 μM cherry pick | 781 |
At the end of all this, we have 781 compounds, an agreeably low hit rate of 0.2%. Now bear in mind, at this point, these compounds have never seen actual PrP. All of the screening and counterscreening here is in this highly artificial system of luciferase expressed under the PRNP 5’UTR. If I were going to follow up on these hits, the next thing I would want to test is whether they reduce actual PrP levels. I’d probably want to use some sort of immunodetection to directly quantify PrP in treated cells.
Aha! Hasn’t that already been done? After all, 98% of the MLPCN compounds in this screen were also included in the Scripps cell surface PrP screen. And while the 5’UTR screen is directed somewhat specifically at a particular mechanism, the cell surface PrP screen is quite mechanism-agnostic, and I’d certainly expect that any compounds that block translation initiation at the PRNP 5’UTR would also reduce cell surface PrP.
If I therefore add one more line to my table, and filter for only those compounds that have at least a whiff of activity (Z > 2) in the cell surface PrP screen, the last row looks like this:
| step | N |
|---|---|
| Also active in Scripps cell surface PrP screen | 11 |
That’s right, only 1.4% (11/781) of the hits I’ve called were also hits in the cell surface PrP FRET screen at Scripps. That surprised me. So I plotted the two screens against one another:
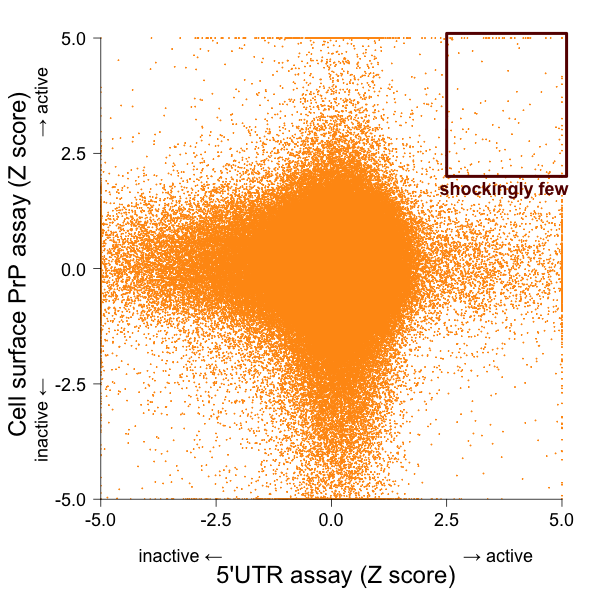
There really are shockingly few compounds that were active in both assays. At first I second guessed myself: did I just do a bad job of deciding what to call as hits? But no, even if I just use the original hit calls — the nomimal ‘Active’/’Inactive’ designation in PubChem — for each assay, I get this contingency table, where the rows are 5’UTR screen and columns are the cell surface screen:
| non-hit | hit | |
|---|---|---|
| non-hit | 326277 | 1310 |
| hit | 1033 | 69 |
While the data are certainly non-random (69 shared hits is a signficant enrichment over the null hypothesis of independence, OR=17, P = 1 × 10-56), it’s hardly the degree of overlap I’d expect given that the mechanisms of action detectable in the 5’UTR screen should be basically a subset of those detectable in the cell surface screen. The main reason why all 69 of these shared hits didn’t show up in my own hit-calling approach above is that 86% (59/69) of these were never screened against SNCA nor APP. Given that this is the case for only 11% of the PRNP 5’UTR compounds overall, this is a suspicious enrichment of compounds that were either added or removed over time. Perhaps this somehow relates to them being bad compounds — in any case, I decided not to follow them up further.
So what about the 11 shared hits according to my hit-calling approach? If those were a really tight series of 11 structurally similar compounds, then they’d really have a lot going for them: activity against models of PrP expression in two totally orthogonal paradigms, and lack of activity in multiple counterscreens. Sadly, though, they seem totally random. Here they are:
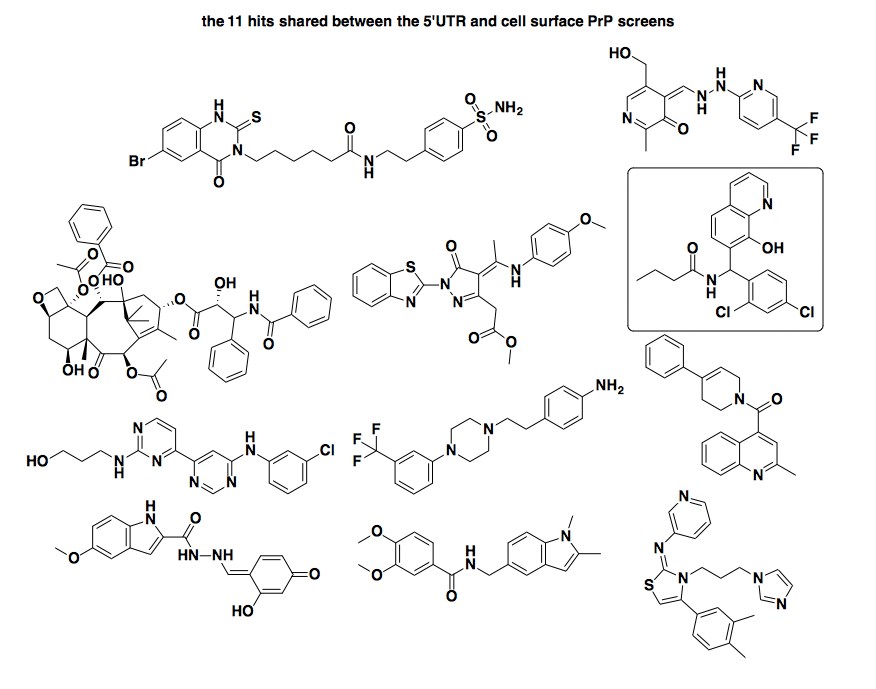
I see absolutely nothing in common between any of these. [Update: some chemists disagree — see this comment below] One compound also caught my eye, the one I’ve denoted in a box near the upper right (SMILES: CCCC(=O)NC(C1=C(C=C(C=C1)Cl)Cl)C2=C(C3=C(C=CC=N3)C=C2)O, PubChem CID: 2921215). This structure looked familiar because, in an earlier version of this analysis, when I had not yet added the cytotoxicity filter step, I had 30 hits for this screen, including one cluster containing this compound and 5 others that were nearly identical to it. But now the other 5 of them are gone - apparently they were all cytotoxic in the IEC6 and/or Ba/F3 cells, leaving only this one. So I looked this compound up in PubChem, and of the 529 assays it’s been screened in, it’s been considered ‘Active’ in 59 (11%) of them. These 59 are some very diverse screens, encompassing everything from inhibitors of SUMOylation to inhibitors of T. cruzi replication, with EC50 values often reported for this compound in low or sub-micromolar range. So: not exactly a specific inhibitor of the PRNP 5’UTR. This motivates the need for some sort of a promiscuity score or filter for compounds with high hit rates — something I hope to either build or borrow in the future.
Having decided that, conditional on the filters applied, there are no real hits at all here, I realized I should go back and second guess the filtering pipeline. Was it really right to require that compounds also be a hit in the cell surface PrP screen? This filter will eliminate loads of compounds that for whatever reason only affect the artificial 5’UTR-luciferase construct but don’t lower actual PrP. That’s good. But this filter will also eliminate any compound whose target is expressed in human glioma cells but not LD9 mouse fibroblast cells, or whose binding site on a target has an amino acid difference between human and mouse. And it will also eliminate any compound that was a false negative in the cell surface PrP screen, for any reason. So by using this filter, we’re putting a lot of faith in the Scripps cell surface PrP screen’s ability to detect true positives. So before second-guessing the analysis so far, I wanted to change gears and spend some time looking at that assay.
cell surface PrP screen
Before digging into the data from the cell surface screen at all, I figured a QC check would be to see if the screen detected any known true positives.
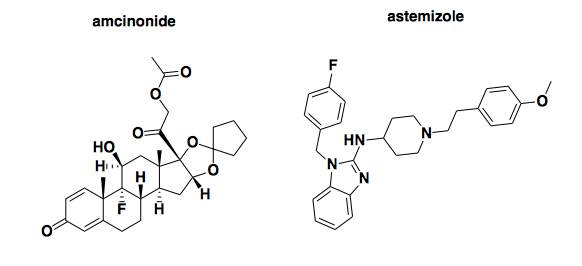
Above: two compounds previously reported to reduce PrP expression.
First, I looked up amcinonide (PubChem CID: 443958). A few years ago, the Prusiner lab reported that this compound reduced proteinase K-resistant PrPSc in ScN2a cells with an EC50 of about 20 μM, though it must have also had at least some activity at only 1 μM, since it was a hit in the primary screen at that concentration [Poncet-Montange 2011]. Its mechanism was apparently to increase the rate of PrPC degradation: it halved the half-life of PrP at 20 μM, and it reduced PrPC expression to basically undetectable at 50 μM (Figure 6). Given that the 20 μM EC50 isn’t so far off from the 13.8 μM concentration used in the Scripps screen, I expected it might have been a hit. It’s not: its inhibition score is -0.82, smack in the middle of the distribution. But maybe that can be chalked up to different cell types, different assay conditions, etc.
More surprising was astemizole (PubChem CID: 2247). It’s not a hit here. For background, astemizole first identified as an antiprion compound in [Kocisko 2003], where it reduced proteinase K-resistant PrPSc with an EC50 between 500 nM and 1 μM in ScN2a cells. Though it was once an approved H1 antagonist (antihistamine), its antiprion mechanism of action was unknown at the time. Years later, it resurfaced when the folks at Scripps conducted a pilot screen of the US Drug Collection [Karapetyan & Sferrazza 2013] as a prelude to the larger MLPCN screen I am discussing here. In that pilot, astemizole was one of nine hits, two of which (astemizole and FK506) were subjected to follow-up assays. It was concluded that astemizole lowered PrPC levels through autophagy induction, with an EC50 apparently around 10 μM (Figure 2). Although its effect on PrPSc clearance was greater than could be explained simply by its effect on PrPC, the fact remains that it was a validated PrPC-reducing hit in the pilot screen, under assay conditions virtually identical to those of the larger MLPCN screen discussed here. The only difference I can see is that the pilot screen was done at 20 μM while the MLPCN screen was done at 13.8 μM, but that shouldn’t matter much, since the pilot data show astemizole being active at lower concentrations than that (Figure 2). Yet here, in the MLPCN screen, astemizole is not a hit. Not even close, in fact: not only was it labeled ‘Inactive’, its inhibition score was -16.7, where the mean across 370,276 compounds was -0.2 and the minimum threshold to be called ‘Active’ was 24.4. This score places it in the 2nd percentile of inhibition score, meaning almost everything tested was more active than astemizole. I don’t know of any other labs that have confirmed the effect of astemizole on PrPC levels, so it’s not clear whether it’s the pilot or the MLPCN screen that got it wrong, but either way, this raises a bit of concern about the reproducibility of this particular screen.
As a third QC check, I looked up the hits from the total PrP screen [Silber 2014]. That screen was done on a separate compound collection, a subset of UCSF’s ChemBrige compounds, but 10 of the 34 reported hits were present in the MLPCN collection screened at Scripps. These 10 are hits that, in the Prusiner lab, passed confirmation and cytotoxicity screening, had some appreciable structure-activity relationship in light of other hits in the screen, and exhibited dose-dependent activity. While I won’t venture to say they’re definitely all “real” — perhaps some could still be aggregators or other pan-assay interference compounds — I would expect at least some of them should turn up as hits in a primary screen for compounds that reduce cell surface PrP. But of those 10, only 1 was a hit. The other 9 were in the middle of the distribution or just slightly above average, so better than astemizole, but certainly not what I’d expect given that the Prusiner lab found that 5 of them had EC50s ≤ 1 μM. Surprisingly, the one shared hit (PubChem CID: 669092) actually was the least potent one in [Silber 2014], with an EC50 of 4.13 μM.
Based on all of these observations, I think perhaps I was wrong to treat this cell surface PrP screen as a confirmation screen for the 5’UTR screen above: if the cell surface PrP screen couldn’t reproduce its own astemizole hit, nor most of the validated hits from the total PrP ELISA screen at the Prusiner lab, then it probably won’t reproduce the hits from the 5’UTR screen either, even if those hits are real. Nonetheless, I decided to set my concerns aside for a while and start calling hits in order to do some analysis on the cell surface PrP screen itself.
Unlike the 5’UTR screen, this screen doesn’t come ready-made with perfect counterscreens, so cytotoxicity would be a pretty obvious source of false positives. I therefore plotted the Z score of the activity in the cell surface PrP assay against the higher of the two Z scores from the cytotoxicity assays:
I called as hits those compounds with Z > 2.5 for cell surface PrP and |max(Z)| < 2 for cytotoxicity. Because data from a confirmatory screen were available, I also removed compounds that were called Inactive in the confirmatory screen, though I retained those that weren’t tested. Here’s how the numbers shook out:
| step | N |
|---|---|
| Unique compounds tested against cell surface PrP | 369946 |
| Active and non-toxic | 1197 |
| Active (if tested) in confirmation screen | 944 |
What to do with these 944 hits, then? Although most of the hits from [Silber 2014] were not included in the MLPCN library, and 9 of the 10 that were included weren’t found as hits, I figured it would still be interesting to see if any structure-activity relationships were shared between the two screens, or in other words, if any similar-but-not-identical compounds were hits in both screens.
There are a lot of different ways to cluster compounds and explore structure-activity relationships. For instance, the Prusiner lab has grouped compounds by shared Murcko fragments in their most recent screens [Silber 2013, Silber 2014]. That approach only looks at specific predefined structural elements: for instance, benzene is a Murcko fragment but bromobenzene is not, so if for some reason bromobenzene was the critical unifying moiety among your hits, you’d miss it. Paul Clemons, who leads the computational chemical biology group at Broad, and has been teaching me some of this stuff, prefers clustering compounds by fingerprints. So I started by computing, for each compound, an ECFP6 fingerprints, which in my case in this particular rcdk implementation [Guha 2007] are strings of 1024 bits, where each bit indicates the presence or absence of a given connectivity motif encompassing atoms within a radius of 3 bonds of a central atom. I then computed a Tanimoto distance matrix among all the hits from the cell surface PrP and total PrP screens, so each cell of the matrix is a number indicating how dissimilar two compounds are. I then performed hierarchical clustering with R’s hclust function, as described in the rcdk tutorial. It is impossible to make any visual sense of the resulting cluster dendrogram, but the important thing to know is that the y axis, which is the ‘height’ of clustering, represents similarity, so that two branches that diverge at the top are very different from one another, while branches diverging at low heights represent pretty similar compounds. I tried cutting the tree at two different heights, 0.6 and 0.8:
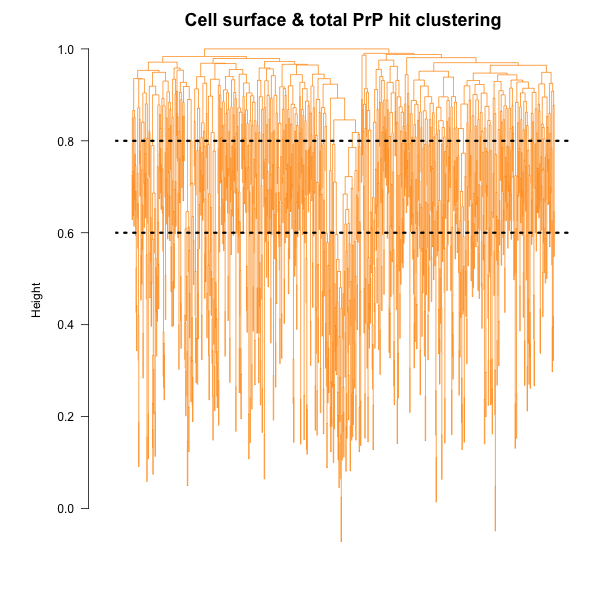
If we cut at 0.6, thus getting groups of compounds that are pretty similar to one another, there is just one cluster that contains hits from both the cell surface PrP screen and the total PrP screen. Actually, it contains just one of each:
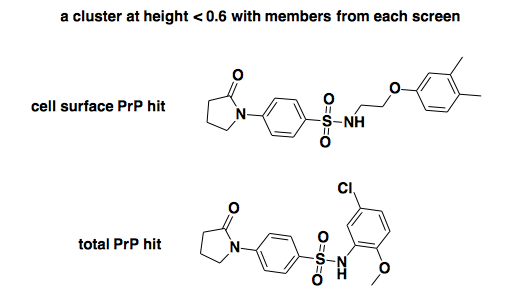
Those certainly look similar enough to be acting by the same mechanism. If we zoom up to height 0.8, there are several clusters, some of which are larger. Here’s the largest one, which contains that one compound that was called a hit in both screens (bottom), plus several hits from the cell surface screen:
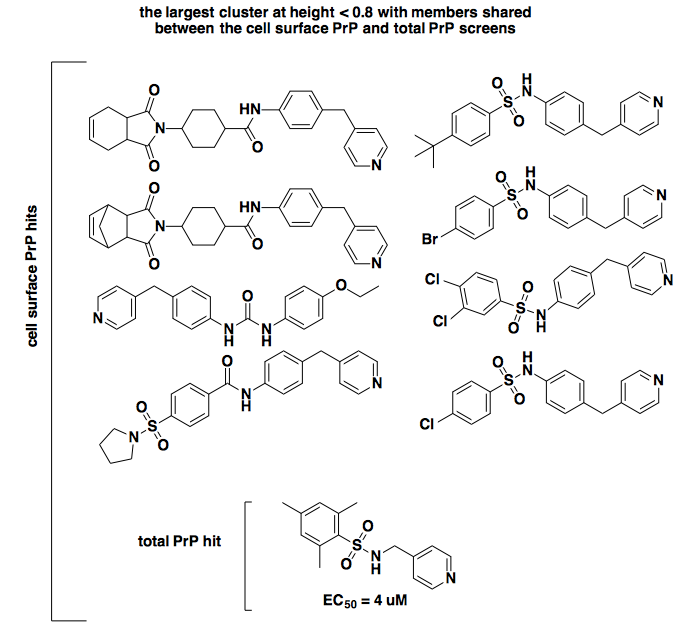
As you can see, by the time we get to a height of 0.8 in this particular tree, the relationship between the compounds is a bit dodgier. The total PrP hit and the four cell surface PrP hits at right clearly share this motif of a sulfonamide with a pyridine on one side and a phenyl group on the other, but the similarity to the hits at left is more tenuous. In any event, though it remains disturbing that the exact same compounds validated in [Silber 2014] were not called as hits in the cell surface PrP screen, this is slightly attenuated by the little bit of shared SAR here.
From browsing these results I concluded, quite arbitrarily, that a height of 0.6 seemed like a reasonable degree of similarity to require to call a group of compounds a cluster. Equally arbitrarily, I decided I wanted to take a look at clusters containing at least 5 cell surface PrP hits (so I’d have at least some starting point of SAR), and no hits from the total PrP screen, so that these would be clusters unrelated to the compounds already studied in [Silber 2014], and thus possibly representing new mechanisms of action. This yielded eight clusters, each containing anywhere from 5 to 20 hits. I then exported their SMILES to a text file and used the command line version of Brian Shoichet’s Aggregator Advsisor tool [Irwin 2015] to check whether any of the compounds were substantially similar to any known aggregators, a common source of false positives. Agreeably, the tool did not find any of these compounds to be similar to known aggregators. So here are these eight clusters for your browsing or downloading enjoyment:
I would be curious for any chemists’ opinion on whether any of these represent “good” clusters worth pursuing further, or whether any of them look similar to any compounds with known mechanisms of action that could be active in this screen.
return to the 5’UTR screen data
Having gone through the above analysis of the cell surface PrP screen, I decided to go back and take a look at the 5’UTR hits that were not shared in the cell surface PrP screen. I subjected them to the same analysis: cluster them with the total PrP hits, cut at height 0.6, and consider clusters with ≥5 compounds from the 5’UTR screen but none from the total PrP screen, to look for potentially new mechanisms of action. Once again, none of the resulting clusters contained any predicted aggregators according to the Shoichet Lab’s tool. This time the analysis yielded just three clusters, PDF here:
conclusions and future directions
As I said at the outset, this was a very preliminary and exploratory analysis. A few potential next steps could be:
- Cluster all of the compounds, not just the hits. This would make it possible to do a more rigorous statistical analysis. Right now, some of the clusters I’ve found might represent structural motifs enriched among hits, but others might simply represent structural motifs that are found in so many MLPCN compounds overall that they just by chance happen to be present in many of the hits. It would be nice to consider only the clusters that are actually signficantly enriched for hits. I originally set out to cluster all of the compounds, but the O(N2) complexity of constructing a similarity matrix of 370,000 compounds got the better of me, so I need to learn more about better ways to accomplish this.
- Related to point #1, hopefully find some less arbitrary way of selecting clusters rather than just a particular cut height in the dendrogram and a particular minimum number of compounds.
- Find or develop some sort of filter for promiscuous compounds that are hits in lots of very different screens in PubChem. This could possibly be used to exclude specific compounds, or maybe even also whole clusters that are enriched for those compounds.
I welcome any other suggestions from readers!

About Eric Vallabh Minikel
Eric Vallabh Minikel is on a lifelong quest to prevent prion disease. He is a scientist based at the Broad Institute of MIT and Harvard.