Survey of fluid biomarkers in prion disease
It’s time to review a subject I’ve covered only piecemeal on this blog: fluid biomarkers, meaning, the markers of prion disease brain pathology that can be detected in cerebospinal fluid (CSF) or in blood. Most of the papers in this area are focused on diagnosis — identifying the biochemical signatures that distinguish prion disease from phenotypically similar diseases. And indeed, the diagnosis of prion disease has improved greatly over the past two decades thanks in part to some of the biomarkers covered here (and also thanks in part to imaging). But naturally, what’s of greatest interest to me is the extent to which any of these markers might or might not be useful in clinical trials. Specifically, two questions:
- Are there any markers that might give an early signal of when someone at risk (a PRNP mutation carrier, say) is close to onset?
- Are there any markers that one might expect to change upon disease-modifying treatment (either in such a close-to-onset person or in a symptomatic patient)?
I should say up front that both of these questions are science fiction for the time being: to date, no one has reported any consistent prodromal pathological changes in mutation carriers. The few reports available on presymptomatic imaging tend to suggest that even if there are any changes, they’d be detectable at best only a year or so before onset. Even if changes could be detected, establishing their predictive value would be a long road. And there are no disease-modifying treatments for prion disease yet, so showing changes in a biomarker as a result of one is a ways off and is something that could only be tested in a clinical trial.
Still, these are questions that come up frequently, and so over the past several months Sonia and I have spent more time reading and thinking about them. This blog post reports back on our dive into the literature to see what’s relatively more plausible and what’s relatively less plausible.
14-3-3
14-3-3 is probably the oldest CSF biomarker still in any use for diagnosis of prion disease today, and a look into its origins ended up being a deep dive.
In the 1980s, Carleton Gajdusek’s group at NIH went on an unbiased search, using 2D gel electrophoresis, for any proteins in CSF that were specific to prion disease patients. Among their findings were two proteins, dubbed 130 and 131, that were usually found in prion disease patients’ CSF and almost never in the CSF of patients with other forms of dementia or brain infections [Harrington 1986]. After another ten years of work, researchers managed to purify sufficient quantities of these two proteins from human brain to subject them to amino acid sequencing [Hsich 1996]. The amino acid sequences turned out not to be novel: they matched a protein, or actually a set of proteins, that had already been discovered and for which antisera already existed. The family of proteins was called 14-3-3, a name which according to Wikipedia came from the fraction (#14) of cattle brain in which it was found and the position (3.3) to which it migrated upon 2D gel electrophoresis, although the reference for this is a book that the internet doesn’t contain [Moore & Perez 1967]. In any event, armed with the antisera, the researchers showed that it was possible to detect 14-3-3 proteins consistently in prion disease patient CSF and only rarely in the various control CSF samples that they tested [Hsich 1996].
The two forms found specifically in prion disease CSF [Hsich 1996] were the gamma (γ) and eta (η) isoforms, encoded by the genes YWHAG and YWHAH respectively. That first study [Hsich 1996] used polyclonal antisera (serum containing many different antibodies) against the beta (β) isoform of 14-3-3, and because the antisera reacted with many different proteins in CSF, you had to look past all the garbage on the gel and examine it carefully for a band at about 30 kDa molecular weight, which was only thing specific to prion CSF. Researchers soon started work on developing monoclonal antibodies against 14-3-3 γ and η but even these were not completely specific to one protein [Takahashi 1999], and the band of interest was determined to be at 32 kDa. (As far as I know, to this day, the 14-3-3 assay used clinically is still often done as a Western blot to discriminate molecular weights, although some labs use ELISA and there is evidently no accepted standard method [Geschwind 2003].)
So what is 14-3-3, and what does it mean that it is elevated in the CSF of prion disease patients? Not long after 14-3-3γ/η was proposed as a diagnostic marker for prion disease, one study found that these proteins were broadly expressed in brain tissue — in humans and other animals, prion-infected or not, in neurons and glia alike, there was just lots of 14-3-3 in the brain [Satoh 1999]. Moreover, 14-3-3 was detectable in the CSF of a number of non-prion patients, who had brain infections or autoimmune disease and had MRI or other lab tests suggestive of extensive brain damage. This led the authors to suggest that 14-3-3 was just a highly expressed intracellular protein that “might be released into the CSF as a disease-nonspecific consequence of the extensive destruction of brain tissues” [Satoh 1999]. And indeed, in all the biology of prion disease that we’ve learned in the 20 years since then, 14-3-3 has never come up as having any particular biological significance. It probably has nothing to do with prion disease at all and really is just a marker of brain cell death, or at least damage.
Whether the assay is useful in diagnosing prion disease has been hotly debated. Some studies have replicated the original finding that 14-3-3 has fairly decent performance, with something like 90% specificity and 90% sensitivity to prion disease [Zerr 1998, Collins 2000, Lemstra 2000], while others reported that the test is often positive in non-prion neurological disorders [Burkhard 2001] and is positive in only about half of prion disease patients [Geschwind 2003]. The test appears to be particularly poor in certain genetic subtypes of prion disease, including GSS, where only ~50% of patients are positive, and FFI (D178N), where only ~20% are positive [Kovacs 2005].
The fact that the test has poor sensitivity in genetic prion disease even after onset is a hint that 14-3-3 probably isn’t the best place to look if you are looking for something to change before onset in PRNP mutation carriers. And while it’s certainly conceivable that a therapy could slow down the rate of neuronal death, thus lowering CSF 14-3-3, the presence of 14-3-3 in the first place might suggest that some degree of irreversible damage has been done, limiting the good that a therapy can do. But I should add that this is conjecture, and I am not aware of any proof that 14-3-3 necessarily indicates neuronal death as opposed to some more potentially reversible form of damage.
tau
Tau, encoded by the gene MAPT, plays many different roles in neurodegenerative disease. Its native function is structural. Its gene symbol stands for microtubule-associated protein tau, and it apparently plays some role stabilizing microtubules and structurally supporting neuronal axons, although tau knockout mice are weirdly fine [Harada 1994].
The role of tau in disease can be confusing because it means different things in different diseases, and there are different forms of tau that can be measured. One often hears of total tau and phospho-tau, although phospho-tau itself is more than one thing, as there are antibodies specific to tau protein phosphorylated at different serine residues. And tau has multiple alternative splicing products, so there are different isoforms of tau that can be measured as well. Here’s the most simplified breakdown as I currently understand it:
- Tauopathies are a group of neurodegenerative diseases that share tau as the unifying causal protein. These come in a variety of phenotypes and a variety of etiologies. There are Mendelian genetic forms caused by MAPT mutations, including many cases of frontotemporal dementia (FTD) and progressive supranuclear palsy (PSP). There are also sporadic forms of those two phenotypes as well as others such as corticobasal degeneration. And there is chronic traumatic encephalopathy (CTE), caused by repeated head injury. Regardless of etiology, all of these diseases are characterized by accumulation of misfolded tau protein in neurons, without the Aβ plaques that characterize Alzheimer’s disease. In the cerebrospinal fluid of these individuals, the level of total tau is similar to normal controls [Bian 2008] but some types of phospho-tau are modestly elevated [Hampel 2004].
- Alzheimer’s disease is characterized by extensive tau tangles — misfolded and hyperphosphorylated — in neurons in addition to Aβ plaques. If only we knew what Alzheimer’s disease truly is, we would be able to say more definitively what tau’s role is. But the tau pathology comes years after the Aβ plaques form, and MAPT mutations don’t cause Alzheimer’s, so many people think that Aβ misfolding is causal, while tau misfolding is a secondary pathology on pathway to neuronal death. In any case, in cerebrospinal fluid, both total tau and phospho-tau are elevated in Alzheimer’s disease [Hampel 2010].
- Prion disease seems to have no causal role for tau, but nevertheless, total tau is wildly elevated in cerebrospinal fluid in prion disease patients [Otto 1997, Otto 2002, Skillback 2014a]. Phospho-tau is, however, not as elevated in prion disease as it is in Alzheimer’s disease, and may even be similar to normal controls [Riemenschneider 2003, Satoh 2006, Abu Rumeileh 2017]. The elevation in total tau in prion disease seems to come entirely from non-phosphorylated tau, which may be a better diagnostic marker for distinguishing prion disease from Alzheimer’s [Skillback 2014a, Ermann 2018]. Prion disease brains on autopsy do occasionally exhibit some tau pathology [Tousseyn 2015], but this is true in only a minority (about 10%) of cases, so this is unlikely to be the reason why CSF total tau is almost always wildly elevated in prion disease.
The above points aren’t even exhaustive — MAPT is also a genome-wide association study hit for Parkinson’s disease [Edwards 2010, Do 2011], although the biological significance of this is not yet clear, and tau has also been found elevated in CSF in other neurological conditions including brain injury [Ost 2006].
For all the above complexities, in prion disease, the picture is probably pretty simple. Just like with 14-3-3 protein, tau is simply a cytosolic protein whose leakage into CSF reflects neuronal injury or outright neuronal death.
CSF tau may have better diagnostic sensitivity and specificity in prion disease than 14-3-3 does (see refs above), and for a long time was considered the front line diagnostic tool for prion disease. For instance, as recently as 2014, RT-QuIC (see below) was starting to be implemented but was still too expensive to run for every patient referred with suspected prion disease, so was done only for patients with elevated tau. As far as I know, nowadays RT-QuIC is run on all CSF samples referred with possible prion disease, at least in the U.S., and so has either replaced or joined tau has the front-line diagnostic tool.
It’s also worth mentioning serum tau (as opposed to CSF tau) as an emerging biomarker. Because tau is a neuronal protein, it’s not normally found in any appreciable abundance in blood. When neuronal injury or death is happening, tau becomes elevated not only in CSF, but also in serum. The absolute concentrations in serum are far lower than in CSF: for example, one study found that when comparing controls to symptomatic prion disease patients, CSF total tau rose from hundreds of pg/mL to thousands of pg/mL, while serum total tau rose from <1 pg/mL in controls to tens of pg/mL [Steinacker 2016]. Because serum tau is so much less abundant than CSF tau, it’s only in the past few years that the development of an ultra-sensitive bead-based assay by Quanterix [Randall 2013] has allowed it to be measured. Just in the past three years there have been three papers quantifying the elevation of serum tau in prion disease patients [Steinacker 2016, Kovacs 2017, Thompson 2018].
What about tau as a therapeutic biomarker? Tau certainly fits many of the technical parameters you’d want in a therapeutic use case. For CSF tau, there’s an ELISA kit whose manufacturer has validated it to FDA standards [Lachno 2011], and CSF tau apparently exhibits excellent test-retest reliability, at least in Alzheimer’s patients [Galasko 1997, Shaw 2009] although as far as I can tell, no one has assessed test-retest in prion disease patients. Biologically, it’s less clear whether tau fits the bill. Just like with 14-3-3, you could argue, though there’s no hard proof, that tau’s presence in CSF probably means neurons are already dying. That doesn’t necessarily mean a therapy couldn’t work at this stage, but it may limit the amount of good that could be done. And while CSF tau appears somewhat elevated in most symptomatic genetic prion disease patients, it is less elevated than in sporadic CJD, and some genetic patients are similar to controls [Steinacker 2016, Kovacs 2017]. This suggests that the prospects for using tau to predict imminent onset in at-risk genetic patients are more limited. There is one case report of an apparently presymptomatic P102L mutation carrier 2 years before onset, with normal CSF tau [Steinacker 2016] (see further discussion of this case under NfL below). In any event, there is at least some signal that tau may continue to rise after symptom onset in prion disease [Skillback 2014a, Thompson 2018], and in sporadic CJD, its level (both in CSF and blood) predicts remaining survival time [Staffaroni 2019]. These are all useful properties for a biomarker to have in symptomatic disease (see discussion at bottom).
alpha synuclein (α-syn)
As with tau, there is the potential for confusion here because alpha synuclein means different things to different diseases. Alpha synuclein, encoded by the gene SNCA, is the causal protein in synucleinopathies, including Parkinson’s disease, multiple system atrophy (MSA), and Lewy body dementia (DLB). Because synthetic α-syn fibrils [Luk 2012] and misfolded α-syn from MSA patients’ brains [Prusiner 2015] can transmit disease to mice, misfolded α-syn can be considered a proteinaceous infectious particle or “prion”, and so many people refer to the synucleinopathies as being prion diseases. Simply for clarity and not out of any ideological position, on this blog I generally reserve the term prion disease for the disease caused by PrP, which does not include Parkinson’s, MSA, etc.
Despite this, it turns out that CSF α-syn is dramatically increased in individuals with prion disease [Kasai 2014, Llorens 2015, Llorens 2017a, Llorens 2018]. Cohorts of people with other dementias, including Alzheimer’s disease as well as some synucleinopathies (Parkinson’s, DLB) had average CSF α-syn around 200 - 300 pg/mL, while sporadic CJD patients had an average CSF α-syn value about 20-fold higher, at 5,703 pg/mL [Llorens 2018]. The magnitude of this increase means that one can draw a cutoff with >90% diagnostic sensitivity and specificity. This increase was also seen in genetic prion disease with the E200K mutation, but not with D178N or P102L, both of which had CSF α-syn numbers similar to non-prion dementias.
Why is alpha synuclein elevated in prion disease CSF? As with tau, it is the case that alpha synuclein pathology is occasionally seen in prion disease brains [Haik 2002, Kovacs 2011], but not always, and the α-syn bodies don’t necessarily co-localize with PrP deposits, and overall there is no evidence for a causal role for alpha synuclein in prion disease. Therefore, the leakage of alpha synuclein into CSF is probably not reflective of something fundamental about the disease process. One possibility is that this may simply be the same story with 14-3-3 and tau — an intracellular protein whose leakage into CSF is an indicator of rapid neuronal destruction. Because prion disease is so much more rapid than other dementias, the rate of destruction is higher, and so the level of alpha synuclein in CSF is higher too. One argument against this view is that, although tau is most dramatically elevated in prion disease, it is still at least somewhat elevated in Alzheimer’s and other slowly progressive dementias, when compared to people with non-neurodegenerative neurological conditions (see above). In contrast, alpha synuclein does not appear to be elevated in slowly progressive dementia [Llorens 2018]. This could suggest that alpha synuclein’s release into CSF in prion disease reflects some as-yet-uncharacterized process more specific to prion disease — perhaps something to do with alpha synuclein secretion or its enrichment in post-synaptic terminals [Llorens 2018]. But we don’t know yet, and one simple alternative would be that the different behavior between tau and synuclein is just a matter of protein half-life. If alpha synuclein has a shorter half-life than tau, then it would take a more rapid neuronal destruction process to bring the CSF level significantly above baseline. Indeed, in a quick search, I found papers saying that synuclein has a half-life of <1 day [Cuervo 2004] while tau has a half-life of ~10 days [Yamada 2015]. Granted, these numbers may not reflect the most relevant measurements, since what you really want to know is the half-life in CSF and/or for cleanup by microglia after neuronal death, rather than the normal half-life in intact brain or cultured cells. Still, these figures point to a possible explanation for the different behavior of tau and alpha synuclein in prion disease CSF, and until we know more, I think it’s a reasonable null hypothesis to assume that both of them may simply mark neuronal death or damage.
We don’t yet have any data on how early alpha synuclein starts to rise, or whether it keeps rising longitudinally after onset, which would both be useful things to know. Overall, the prognosis for alpha synuclein as a biomarker of disease pathology in a trial is similar to that for tau — if it indeed marks neuronal damage or death, then being able to show that you lowered that signal would be useful, but waiting for that signal to rise could also be fundamentally limiting. The lack of a clear increase in some forms of genetic prion disease is also a limitation.
neurofilament light (NfL)
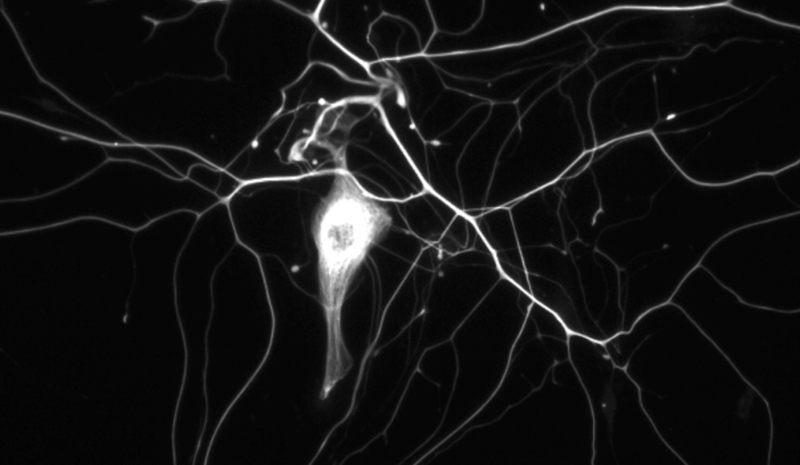
Above: neurofilament in cultured mouse neurons. From Figure 1 of [Zhao 2017].
If you’re like me, you took a cell biology class at some point, and you learned that cells have three types of cytoskeletal elements: microfilaments made of actin, which get a full lecture, microtubules made of tubulin, which likewise get a full lecture, and intermediate filaments, which get only a hand-waving sentence to the effect that they are tissue-specific. Neurofilament is one of those intermediate filaments, and is specific to neurons. Neurofilament comes in 10 nm diameter fibers is made up of three protein constituents, with molecular weights of 68, 150, and 200 kDa, named neurofilament light, medium, and heavy, and encoded by genes NEFL, NEFM, and NEFH. See [Zetterberg 2016b] for a nice commentary on the history and biology of neurofilament.
Neurofilament is often described as being found in the “axoplasm” (the cytoplasm of axons), although the immunocytochemistry pictures I found on Google image search (such as the one above) show staining for neurofilament in the cell body as well.
Neurofilament light chain (NfL) is found elevated in CSF in a wide range of neurodegenerative diseases, such as ALS and Alzheimer’s [Rosengren 1996, Skillback 2014b, Zetterberg 2016a]. More recently, NfL has been detected in serum as well, in diseases like ALS, FTD, Huntington’s, and Alzheimer’s [Lu 2015, Rohrer 2016, Byrne 2017, Weston 2017]. As with tau (see above), this advance had to await the development of an ultra-sensitive bead-based assay, since serum NfL levels are much lower than CSF levels [Rohrer 2016]. The Huntington’s disease study is particularly interesting, since it included a large number of pre-symptomatic individuals with HTT mutations, and showed a rise in serum NfL over time many years before expected onset [Byrne 2017]. This has caused some excitement about the idea that NfL could be used as a biomarker in clinical trials to tell if a drug is working even before onset of any symptoms.
Relatedly, it is worth mentioning that NfL is increased in CSF not only in neurodegenerative diseases, where patient decline is monotonic, but also some relapsing-remitting conditions such as multiple sclerosis (MS) [Lycke 1998, Teunissen 2005]. This seems interesting because to my limited understanding, MS is associated primarily with neuronal damage — loss of myelin and loss of axons — rather than outright neuronal death [Dutta & Trapp 2011]. This may suggest that NfL in CSF can in some cases signal a degree of neuronal distress that is still reversible. And indeed, there is a precedent for treatment lowering NfL in multiple sclerosis. In patients with relapsing multiple sclerosis treated with natalizumab (Tysabri®, a Biogen monoclonal antibody against α4-integrin), CSF NfL levels averaged 2.3±3.6 (mean±sd) ng/mL before treatment and 0.35±0.17 ng/mL after treatment [Gunnarsson 2011].
In prion disease, until recently, there were only two brief reports of NfL in CSF [van Eijk 2010, Steinacker 2016]. Earlier this year, two studies came out characterizing CSF NfL in large cohorts of symptomatic prion disease patients and showing that NfL is crazily elevated in prion disease [Abu-Rumeileh 2018, Zerr 2018], many times moreso than in Alzheimer’s. In one study the median CSF NfL concentration in healthy controls was ~1 ng/mL, in Alzheimer’s it was ~2 ng/mL, and in prion disease it was ~12 ng/mL [Abu-Rumeileh 2018]. The other large study had CSF NfL averages at ~2 ng/mL in controls, 5-7 ng/mL in Alzheimer’s and 30-42 ng/mL in prion disease [Zerr 2018]. CSF NfL was even fairly elevated in the more unusual subtypes of genetic prion disease, including P102L and D178N, where tau is not so highly elevated [Zerr 2018]. That said, the variances on all those distributions were large, such that in both studies there were still some prion disease patients who had CSF NfL concentration that was quite low, in the range of controls [Abu-Rumeileh 2018, Zerr 2018].
All told, NfL looks promising, and it would be interesting to know whether any elevation in CSF or serum NfL can be detected prior to disease onset in mutation carriers. As with tau, all we know right now comes from one case report containing a P102L individual apparently 2 years before symptom onset [Steinacker 2016]. I take this report with a grain of salt because the paper doesn’t provide any evidence that the patient is asymptomatic, and since P102L is a slowly progressive mutation, one wonders how he/she came to be included in the cohort 2 years before onset — was it in fact due to some very early, ambiguous symptom? In any event, that patient’s CSF NfL level was towards the high end, but not outside the range, of healthy controls, while serum NfL was normal. We’ll need to see larger pre-symptomatic cohorts to know whether fluid NfL levels have any prognostic value.
YKL-40
YKL-40 is a protein secreted by astrocytes, and thus a marker of astrogliosis (proliferation of astrocytes), which is seen in prion disease as well as other neurodegenerative diseases and is described as being a type of neuroinflammation. YKL-40 is fairly abundant in CSF — hundreds of nanograms per mL — and on average is just modestly (1.25- to 1.75-fold) increased in Alzheimer’s disease compared to controls [Craig-Schapiro 2010, Bonneh-Barkay 2010, Rosen 2014, Janelidze 2016], though the distributions overlap plenty.
One of the neuropathological changes seen in prion disease is dramatic astrogliosis — in fact, this is one of the earliest pathological changes detectable by gene expression signatures [Hwang 2009]. Tg(Gfap-luc) mice, a transgenic line that express luciferase under an astroglial promoter, exhibit increased bioluminescence indicative of astrogliosis detectable in prion-infected mice as early as 55 days post-infection [Tamguney 2009], and can provide an early readout of therapeutic efficacy [Lu & Giles 2013]. This proof of concept from mice might lead you to expect that YKL-40 would be worth exploring as a candidate biomarker in prion disease. And indeed, a study last year showed that YKL-40 is elevated by ~2-fold in prion disease CSF [Llorens 2017b]. Just as with tau and NfL, it turns out to be more elevated in prion disease than in Alzheimer’s. Findings were similar for sporadic CJD and E200K genetic prion disease, with a less dramatic but still significant elevation in D178N genetic prion disease. In all cases, though, we’re talking about differences between group averages. The variation in CSF YKL-40 was wide, and the prion disease individuals overlapped with healthy controls. The combination of this variability with only a modest (~2-fold) average elevation in prion disease, compared to >10-fold elevation for tau and NfL, makes YKL-40 somewhat less likely to be of value as a therapeutic or prognostic biomarker.
RT-QuIC
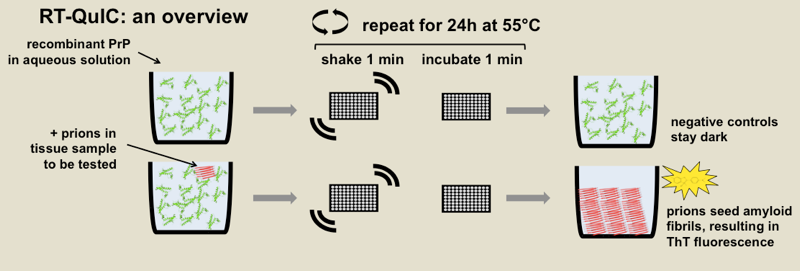
Above: diagrammatic overview of RT-QuIC.
I’ve blogged about RT-QuIC a few times before, so I won’t belabor it, but I’ll give a brief intro for those hearing about it in this post for the first time.
RT-QuIC stands for real-time quaking-induced conversion, and it is an in vitro fibrillization assay to detect misfolded forms of PrP. Correctly folded recombinant PrP is combined with buffer, usually some detergent, and the amyloid-binding dye thioflavin T (ThT) in a 96-well plate, and then spiked with samples of brain homogenate or CSF or some other biological sample. After hours or days of heating and intermittent shaking, the recombinant protein will misfold into amyloid fibrils if and only if there are misfolded prions in the biological sample available to template it into misfolding. Thus, because ThT fluoresces upon binding amyloid, you get a fluorescent readout if and only if there were prions in the sample being tested. The diagram above shows the principle of the assay and is annotated with the specific parameters from one RT-QuIC protocol [Orru 2015a].
RT-QuIC was invented eight years ago [Wilham 2010] and has been applied to CSF for almost as long [Atarashi 2011, McGuire 2012]. In the years since I learned how to do RT-QuIC at Rocky Mountain Labs, the technique has exploded and become a standard tool in many or most prion labs worldwide. So it’s worth taking a minute to review all the advances that have been made. RT-QuIC has been applied to a dizzying variety of different species and different tissues, from human nasal brushings [Orru 2014] to elk rectal mucosa [Manne 2017], and it has been implemented with a wide variety of different recombinant PrP substrates and myriad permutations of temperature, salt concentration, and other conditions. There is a nice review of the development of the method in [Schmitz & Cramm 2016] and there is a fairly comprehensive survey of implemented assay conditions in [Orru & Hughson 2016]. Meanwhile, there has been some impressive technical validation of RT-QuIC. One study found remarkable consistency in “ring trial” results with the same samples analyzed at a total of six different sites, as well as doing a detailed breakdown of the effects of blood contamination and storage time and temperature on assay validity [Cramm & Schmitz 2016]. And a series of studies using the so-called “new” or “IQ-CSF” assay conditions [Orru 2015a] have found >90% sensitivity and >98% specificity across hundreds of samples [Groveman 2016, Franceschini 2017], including one prospective study [Foutz 2017].
As a result of all this progress, RT-QuIC is now used by many prion surveillance centers as a front-line diagnostic tool. These days, when I get emails from people who have just had a loved one diagnosed with prion disease, they often tell me that their neurologist sent a CSF sample to the U.S. surveillance center in Cleveland and it came back positive for RT-QuIC. It’s remarkable how quickly RT-QuIC has surged to the forefront of prion disease clinical diagnosis, less than a decade after its invention, and how widely used it has become as a molecular biology tool in prion labs. And it makes sense that RT-QuIC would be so successful: unlike the biomarkers discussed above, RT-QuIC is actually measuring the molecular cause of prion disease, misfolded PrP.
Against the backdrop of all this progress, though, it is important to keep in perspective what RT-QuIC still can’t do.
First, in general, RT-QuIC is not highly quantitative. It is mostly deployed as a qualitative assay: are there prions in this sample, yes/no, +/-. In brain tissue, you can get a rough, order-of-magnitude estimate of prion titer by performing endpoint dilution, as we did here, and then using Spearman Karber analysis. Or, some groups have reported assay conditions where the lag time itself may be used as a quantitative readout of prion titer in brain [Shi 2013, Shi 2015], analogous to how incubation time can be used in lieu of endpoint titration to determine prion titers in bioassay [Prusiner 1982b]. But all of that is in brain, where you are starting with something like 109 infectious units, whereas neat CSF is already pretty close to endpoint, meaning you can’t dilute it very much and still detect any prion seeds at all [Orru 2015a]. So if you had a drug that lowers prion titer by 1,000-fold, great, but if it lowers prion titer by half, you’re still at about the same order of magnitude and it’s not yet clear whether RT-QuIC could reliably detect such a change in CSF, nor is it clear how much of a change you would want to see in order to believe that your drug is working.
Second, when used for CSF, RT-QuIC is really at its most sensitive in sporadic CJD; its sensitivity in many genetic subtypes of prion disease appears much lower, based on the limited data available. For instance, the newer “IQ-CSF” protocol detected 20/20 cases with the E200K mutation, which causes a form of prion disease very similar to sporadic CJD, but detected 0/2 cases with the D178N mutation and 1/3 with the P102L mutation [Franceschini 2017]. And remember that converting a raw kinetic curve from RT-QuIC reactions into a yes/no answer requires drawing a cutoff on three dimensions: lag time (how long are you willing to wait for a well to turn fluorescent), magnitude (how high does fluorescence need to go to count as positive), and number of replicates (is 2/4 replicates of a sample enough, or do you need 3/4 to turn positive). Even when CSF samples from people with the D178N mutation are nominally called as positive, it is often the case that the lag time is much longer, and peak fluorescence much lower, than in typical curves from sporadic CJD [Sano 2013, Cramm 2015]. This makes me somewhat less optimistic that any prodromal signal of pathology could be detected before disease onset by RT-QuIC in mutation carriers, and also less optimistic that any beneficial effect of a drug could be quantified using RT-QuIC.
Third, we still don’t know much about how CSF RT-QuIC seeding activity behaves over time, either pre- or post-onset. In principle, RT-QuIC seeding activity could be detectable before neuronal damage markers, since prion disease is characterized by a period of silent prion replication before brain pathology becomes visible. But whether seeding activity is detectable in practice comes down to a practical question of how early prion seeds are above the limit of detection in an accessible fluid, probably CSF. One study in hamsters used RT-QuIC to measure a rise in prion titer leading up to symptoms in both brain and CSF [Orru 2012]. When the hamsters were prion inoculated intracerebrally, prions were detectable by RT-QuIC in CSF 30 days post-inoculation (dpi) while the hamsters didn’t get sick until 60 dpi. But when the hamsters were inoculated into the tongue, RT-QuIC detection of prions occurred at 85 dpi while disease onset was at 91 dpi. It’s not clear which is the better model of genetic or sporadic prion disease, where prions must arise spontaneously in the brain, and so it’s not clear what this tells us about the propsects for pre-symptomatic detection of prion seeds in humans. Meanwhile, the kinetics of prion propagation, at least as worked out in rodent brain, are that prion titer amplifies exponentially over a silent incubation period, and then plateaus at the onset of symptoms [Prusiner 1982a, Sandberg 2011, Sandberg 2014]. We might therefore expect that RT-QuIC activity would be constant over time after symptom onset, but to my knowledge no one has yet had the human samples to look at this in a systematic way. All I have been able to find are a few isolated mentions of single cases, such as this one: “one patient with E200K gCJD was negative by RT-QUIC when sampled at 2 months after the symptom onset, but became positive when a second sample was obtained two months later” [Sano 2013], but there may be ascertainment bias at work in which cases even get repeat CSF samples (see discussion at bottom of this post).
All that is to say, there is a lot that RT-QuIC can’t do, at least not yet. That said, there is a lot of technology development going on in this area, and hopefully the coming years will see RT-QuIC applied to much larger cohorts of genetic prion disease and other atypical prion subtypes, presymptomatic individuals, and repeat CSF samples from the same individuals over time.
total PrP
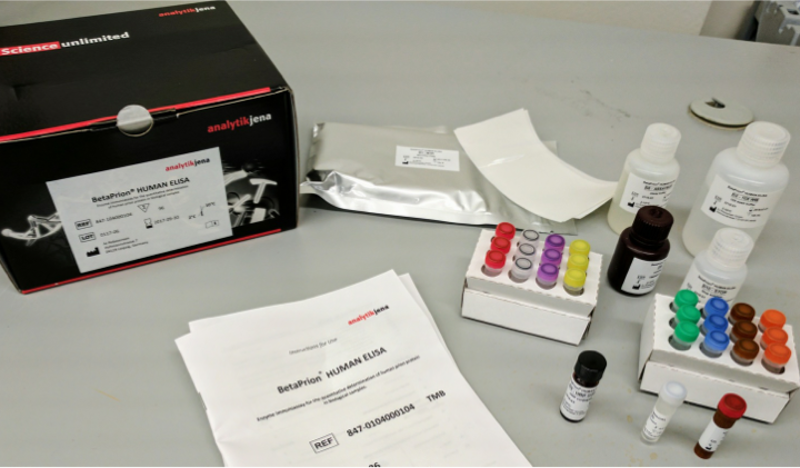
Above: the BetaPrion Human ELISA kit for quantifying CSF PrP.
In contrast to RT-QuIC, which measures the number of misfolded prion “seeds” in CSF, here we are talking about PrP quantified by immunoreactivity, so, for instance, by ELISA. While it hasn’t been shown that the ELISA kits used for this purpose are really agnostic to the conformation of the PrP being measured, everyone’s default assumption is that both PrPC and PrPSc would be detected by it, and so most people refer to this measurement as “total PrP”.
Prion disease is caused by a gain of function, and we know from animal models that total PrP in the brain rises over the course of prion disease, with a larger and larger proportion of it being proteinase K-resistant PrPSc [Bueler 1994 - see Fig 3, Moreno 2012 - see Fig 2a, Schulz-Schaeffer 2000 - see Fig 3]. Yet cross-sectional studies have found that the amount of PrP found in CSF is actually lower in prion disease patients than in non-prion disease patients [Meyne 2009, Torres 2012, Dorey 2015, Abu Rumeileh 2017, Villar-Pique & Schmitz 2018, Vallabh 2018]. And indeed, in the limited number of symptomatic samples with longitudinal LPs available, there is a modest, though noisy, signal that PrP continues to decline over the course of disease [Villar-Pique & Schmitz 2018].
There are several possible explanations for this apparent paradox: maybe PrP in prion disease patients is caught up in plaques, analogous to how Aβ is reduced in Alzheimer’s CSF [Andreasen 1999], or maybe it’s internalized into the endosomal-lysosomal pathway where PrPSc seems to replicate [Caughey 1991], or maybe it has to do with post-translational downregulation of PrPC as a function of the disease process [Mays 2014]. In any case, CSF PrP is lower in prion disease patients than in other patients, and several groups have explored this as a diagnostic marker.
On its own, CSF PrP is so-so as a diagnostic biomarker, with sensitivity and specificity values in the 75% ballpark, although when combined with total tau and/or other biomarkers described in this post, the combination can get up into the nineties, at least for distinguishing CJD from Alzheimer’s [Dorey 2015, Abu Rumeileh 2017]. The diagnostic utility of CSF PrP varies a bit depending upon the prion disease subtype — different types of sporadic CJD all had similar reductions in CSF PrP, but for genetic prion disease, the reduction in CSF PrP depended upon the mutation [Villar-Pique & Schmitz 2018].
Across all of these studies, it is clear that the variability in CSF PrP levels between individuals is dramatic. In our recent study, for instance, we found that its levels ranged over two orders of magnitude [Vallabh 2018]. We noticed that PrP is exquisitely sensitive to plastic exposure, and so pre-analytical variability (how many tubes and pipette tips did the CSF touch en route from lumbar puncture to ELISA plate) may be one major contributor to this variability.
The question I’m asking of each fluid biomarker in this blog post is whether it would be valuable as a marker of disease state in a therapeutic trial, and for CSF PrP, some of the same limitations cited for other biomarkers apply. We don’t yet know whether CSF PrP begins to drop before disease onset. It is promising that it appears to continue to decline longitudinally after onset [Villar-Pique & Schmitz 2018], although the effect size is not huge. In addition, as noted in my last blog post on this topic, there may be a large confounder to using CSF PrP as a disease biomarker depending on the mechanism of action of your drug. Lowering PrP is a very promising therapeutic hypothesis in prion disease, and if you were following a drug with this mechanism of action in symptomatic patients, you might not know what to expect. Would PrP go down because the drug makes it go down, or would PrP go up because the drug alleviates the disease state in which PrP is down? For this reason, I expect the utility CSF PrP as a biomarker of the disease state to be fairly limited.
But, and this is the whole point of our new study [Vallabh 2018], CSF PrP could still be very useful as a pharmacodynamic biomarker — meaning, a marker that informs not on the disease state, but on the molecular effect of a drug — in pre-symptomatic people in whom the disease-state lowering of PrP has not yet begun. If you had a drug that lowered PrP (and as we’ve recently announced, one is in development), you could measure PrP before and after you gave the drug, or in people who got drug versus placebo, and you could quantify how much PrP went down as a result of the drug. We found evidence that CSF PrP is brain-derived, so it would report on the right tissue of interest for antiprion drugs. Provided there is uniform sample handling, CSF PrP exhibits good short-term test-retest reliability (stability in one individual over repeat lumbar punctures), so even if it varies a fair bit between individuals, you could still readily quantify a knockdown by following individuals over time. In any clinical trial, quantifying the molecular effect of the drug is crucial — for one example, just look at the excitement over the drug candidate for Huntington’s disease that recently lowered mutant huntingtin by 40% in CSF. So we believe that CSF PrP could have an important role to play as a pharmacodynamic biomarker.
conclusions
All of the biomarkers reviewed here tell you something about things going wrong in the brain, and all of them show interesting changes in prion disease compared to healthy individuals and even compared to other dementias. But in the review of the literature above, you’ll notice two recurring holes in our knowledge.
First, while all of these markers now have a wealth of cross-sectional data, there are still relatively few data available on their test-retest or longitudinal behavior in patients with active prion disease. Reflecting on my own experience with my mother-in-law’s rapid course of prion disease, I realized there may be an obvious reason why it is so. Prion disease often starts with symptoms that are incredibly non-specific — blurry vision, weight loss — and may not even lead to a referral to a neurologist right away. Soon dementia sets in, but there are dozens of possible explanations, many of which are treatable and thus need to be ruled out first. Once those tests come back negative, the possibility of prion disease is raised, and finally a CSF sample gets sent to the surveillance center. By the time it comes back positive, the patient is on life support or close to it, and in light of the terminal diagnosis, the famiy moves them into hospice. A second lumbar puncture is not subsequently performed. In fact, my mother-in-law actually did have two LPs with CSF sent to the surveillance center in 2010, but this just highlights the ascertainment bias inherent in the handful of repeat LPs from which we do have data. A second LP might only be performed in cases where the first LP failed to show evidence of prion disease and so the diagnostic odyssey continued for months longer. In other words, if we only look at the repeat LPs that we have access to, we are likely to find that tau, RT-QuIC, etc. are more often positive in the second LP than in the first, even if the true answer averaged across all prion patients is that they don’t change. This is simply because if the first LP had been positive, there wouldn’t have been a second LP, and if the second LP had been negative, the patient might never have been correctly diagnosed with prion disease.
Why does this matter? Because an ideal biomarker for trials would be one that goes up progressively over time, even after disease onset. If a drug is so potent that it reverses the disease and resolves brain pathology, then you don’t need to worry about biomarkers anyway — you will have a very swift signal of clinical efficacy. The case you need to worry about and prepare for is that a drug given at the symptomatic stage slows the rate of decline but doesn’t actually make people better. This is the case where statistically powering a clinical trial becomes a challenge, and where you need all the biomarker tools you can get. And if a biomarker’s level follows a curve that rises with disease progression, then you can try to show that your drug makes that curve flat. But if the trajectory is flat to begin with, then your biomarker won’t help you.
Therefore, though I can’t immediately think of any way to do it, it would be a great research priority to obtain a truly unbiased set of repeat LP samples from individuals with prion disease in order to really pin down the natural history of these biomarkers after disease onset.
Second, while there are lots of data from symptomatic patients, we know almost nothing about the situation in PRNP mutation carriers before disease onset. Here, too, there some obvious reasons. Most people at risk for genetic prion disease decline predictive genetic testing [Owen 2014]. Those who do get tested have no phenotype so there is no reason they’d have LPs or imaging done clinically. That leaves volunteering for research studies as the only way these folks would have CSF drawn. Prion disease being rare, there aren’t a ton of centers doing clinical research, and many at-risk people just haven’t had an opportunity to volunteer. That said, there are some great efforts underway and hopefully we will begin to have some answers soon. To my knowledge, over most of the past decade, two clinical centers worldwide have recruited presymptomatic at-risk people to participate in research — Michael Geschwind’s Early Diagnosis of Human Prion Disease study at UCSF and Simon Mead’s National Prion Monitoring Cohort at MRC Prion Unit. These are both incredibly valuable cohorts and I look forward to hearing about any characterization of fluid biomarkers in these research volunteers. Last year, here in Boston, we launched a study at Mass General Hospital that is now recruiting presymptomatic at-risk people to donate cerebrospinal fluid. Our primary goal, as explained here, is to look at CSF total PrP levels, but in time we will also look at other biomarkers. Stay tuned.
In other neurodegenerative diseases, there is evidence of prodromal pathology years or decades before onset. For example, in Huntington’s disease there is elevation of serum neurofilament light [Byrne 2017] and loss of volume in certain brain regions [Aylward 2004, Rosas 2005, Tabrizi 2009, Tabrizi 2013] perhaps a decade before onset. In Alzheimer’s disease it has been estimated that amyloid beta deposition detectable by Pittsburgh compound B PET imaging begins 20 years before onset [Villemagne 2013]. But those are slowly progressive neurodegenerative diseases where the disease duration itself can easily be a decade or two. In prion disease, where the disease lasts six months, perhaps a year, from first symptom to death [Pocchiari 2004], it is less clear how early we might reasonably expect to see prodromal pathological changes. The very limited data from presymptomatic imaging studies tell us that there are only subtle, if any, pathological changes detectable by MRI or FDG-PET even 1 year before onset. It’s conceivable that biochemical changes are detectable before imaging changes, and/or that prodromal pathology appears earlier in people with slowly progressive PRNP mutations (which constitute perhaps a quarter of genetic cases). But as of today, we don’t have any data.
All this is to say, there is still a lot of work to do to establish any of the above biomarkers as tools you could use in a clinical trial. But even if and when that work is done and the results look promising, there’s another reason why perhaps none of these would be an ideal clinical trial endpoint. Preclinical studies of antiprion compounds effective in mice have shown us that the earlier you treat, the more good you can do. The later you treat, the less effective a compound is. Consider IND24: treating before prion infection extends survival by 4-fold, treating at a timepoint where there is early pathology but no symptoms still extends survival, but by less than 2-fold, and treating later on, when symptoms are close at hand, has no effect at all [Giles 2015]. So even if we can identify some subset of presymptomatic people who have prodromal biomarkers of pathology, those might be the people least likely to benefit from a drug. This motivates us to think about ways to do clinical trials even earlier, in a “primary prevention” paradigm where the disease process hasn’t even begun yet.
That said, when planning for clinical trials it’s always best to have as many tools available as possible, and I think that most of the above markers are worth studying further. If you’re a person at-risk for genetic prion disease reading this, remember that our MGH clinical study is still enrolling, and has funds to help with travel costs. If you live near San Francisco or London, it’s definitely worth looking into the studies at UCSF and MRC. Finally, remember that PrionRegistry.org is a great resource for standing up and being counted, and for finding research studies to participate in.

About Eric Vallabh Minikel
Eric Vallabh Minikel is on a lifelong quest to prevent prion disease. He is a scientist based at the Broad Institute of MIT and Harvard.