Using genetic data to estimate disease prevalence
introduction
Traditionally, people have estimated how common a genetic disease is by observing the disease itself. With the advent of large databases of population genetic variation, such as gnomAD, there arises a new possibility: estimating the prevalence of a disease based on the frequency of a causal allele in the population. Is this approach legitimate? What are the caveats? Since reviewing a paper that used this approach last year [Gao 2018], I’ve spent some time pondering this issue. In this blog post I will consider the why and how of disease prevalence estimation, the opportunities and potential issues with using genetic data for this purpose, and some potential guidelines for how to do it right.
how to measure how common a disease is
There are a few different ways to measure how common a disease is. Prevalence, where it has a precise definition, is the number of people symptomatic with a disease at any given point in time; I’ve also heard this called “point prevalence”. (Informally, the word “prevalence” can also just refer to how common a disease is, by any measure.) Incidence is the number of new cases (or sometimes new births), per unit time, usually annually. Lifetime risk is the probability of any random person (from birth) eventually developing the disease. The term “genetic prevalence” seems to be used to refer to the proportion of people in the population who have a causal genotype, and assuming full penetrance, this should be equivalent to lifetime risk.
The below diagram illustrates conceptually the different things these three terms are measuring:
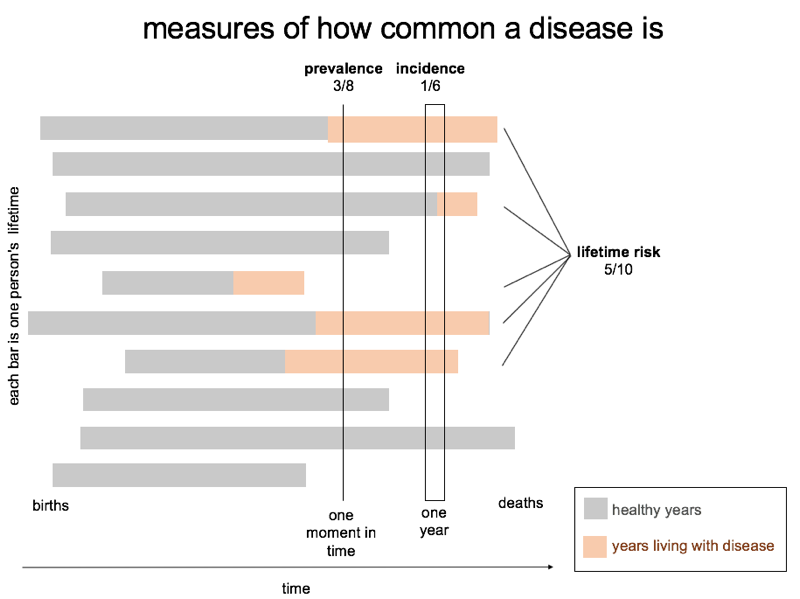
These different measures may be appropriate for different purposes, and many people, even scientists, get confused between them, so it’s important to be clear about what one is estimating and how one arrived at the estimate. At the same time, all of these measures are inter-related, and if you have an estimate of disease duration and age of onset you can derive one from the other. So although I’ve used the term “prevalence” in the title of the post, what’s of interest here, broadly speaking, is simply any metric of how common a disease is.
why this is important
It’s very important to know how common a disease is, for several reasons. Prevalence is one input into the financial models that industry uses to evaluate an investment in R&D to make a new drug, so knowing how common your disease is can affect whether anyone bothers to try to cure it. People’s idea of how common a disease is can affect how they interpret data around them. For example, the misperception that prion disease only affects one in a million people makes things that are actually expected — like occasionally observing a married couple who both develop the disease — seem like crazy coincidences, and drives people to search for crazy explanations like horizontal transmission of prion infection between people. And many diseases, especially rare ones, are under-diagnosed, and if you have a good measure of disease prevalence or incidence that is orthogonal to just counting diagnoses, then you have an idea of how far you have to go in improving diagnosis.
Despite this importance, there are a great many diseases for which we really don’t know how common they are. There are diseases for which there are simply no published estimates, or only outdated estimates. A disease can appear more common the harder you look [Klug 2013], so for instance, as prion surveillance has gotten better over the past couple of decades, prion disease has appeared to be more and more common. And there are those where published estimates disagree wildly with one another, and it’s not clear why. For example, one meta-analysis found that estimates of Huntington’s disease prevalence in people of European ancestry were 10 times higher than in Asian populations [Pringsheim 2012] — does that reflect real differences in biology, differences in diagnosis, or just differences in study design? Considering how important it is, I think this topic is under-studied: there should be more efforts to estimate how common diseases are.
traditional approaches to estimating how common a disease is
It’s worth taking a moment to consider the methods by which people have traditionally estimated how common a disease is, and what different biases and caveats come with each.
The traditional methods for measuring prevalence per se all revolve around counting people with the actual disease. If you’re interested in knowing how many people you could recruit for research or trials, your best resource may be a good registry of patients with the disease. But except in rare cases like cystic fibrosis (the CF Foundation Patient Registry is purported to be darned-near exhaustive) a registry will typically ascertain only a fraction of the true disease prevalence — it’s heavily self-selected for the most motivated patients who want to volunteer for research. In the Huntington’s disease meta-analysis cited above, most prevalence studies reviewed medical records or genetic testing records, others mailed out surveys to doctors or to patients themselves, or even went door-to-door [Pringsheim 2012]. One study aimed to exhaustively ascertain Huntington’s patients in British Columbia by combining every possible approach to tracking them down [Fisher & Hayden 2014]. While some approaches are more thorough than others, the goal of all these methods is to find and count sick people. Remember that prevalence is the number of people sick at one moment in time. If one group of people (say, the patients in one country, or with one disease subtype) live longer with a disease, either due to a different progression rate, better medical care, or simply being kept alive longer on life support, then that group of people will appear more “prevalent” even if their incidence (rate of new cases) is the same as other groups. Example: prion disease patients in Japan survive on average three times longer than patients in Europe [Nagoshi 2011]. The authors speculate in the Discussion that the difference is largely physician reluctance to take patients off of life support. If so, does the longer duration mean prion disease is more “prevalent” in Japan in any meaningful sense? I would argue no — and yet if you count sick patients, you may get an answer three times higher than you would get in Europe.
There are also methods for measuring incidence. The Huntington’s meta-analysis noted above [Pringsheim 2012] includes incidence studies as well, and most are basically the same approaches as the prevalence studies — surveys, medical records review, and so on — but asking the question of how many new cases arise per year instead of asking how many patients are around today. Prion disease studies may count diagnoses made per year at national surveillance centers [Klug 2013] or count the death certificates listing prion disease as cause of death per year [Holman 2010]. ALS studies may count cases referred to national or regional registries [Logroscino 2010]. As above, the big challenge here is that people still only count if they are diagnosed correctly. It’s difficult to know if differences between countries or populations are due to true biological differences or differences in the healthcare system.
Finally, there are also ways to directly estimate lifetime risk. Indeed, for fatal diseases, review of death records can be one such method — divide deaths due to the disease of interest by total deaths in some time period, and you have the lifetime risk in the general population. This has been done for prion disease in the U.S. and U.K.
All the different measures and different approaches listed above share one key source of bias: they depend on correct diagnosis. Neither physicians nor patients nor medical records nor death certificates can tell you that someone should count towards your total if they were never daignosed correctly. So if your hope is to find out whether the condition you’re studying is under-diagnosed, none of these approaches can tell you the answer.
genetics to estimate how common a disease is
Enter a completely different approach: instead of counting disease diagnoses, let’s count disease-causing alleles in people’s DNA. This approach isn’t new. Not long after CFTR ΔF508 was identified as the predominant cause of cystic fibrosis [Kerem 1989], studies began screening for this and other mutant CFTR alleles in the general population try to determine the carrier frequency [Abeliovich 1992]. For years prior, people had inferred what the carrier frequency must be based on the prevalence of cystic fibrosis among live births; now suddenly they had the ability to directly measure the carrier frequency, and ask whether the predicted prevalence matched observation.
That worked for cystic fibrosis in the 1990s only because cystic fibrosis is so darn common: ΔF508 alone has an allele frequency of 1.3% in people of European ancestry. Most genetic diseases are far, far rarer. Even for Huntington’s disease, which is far from being the rarest genetic disease out there, the earliest study I’m aware of that screened for mutant HTT alleles in the general population was only a few years ago, and even then, the sample size was still small enough to leave fairly large error bars around the true genetic prevalence — they found that 3 out of 7,315 people had high-penetrance alleles [Kay 2016].
For many diseases, then, only in the past few years with ExAC and gnomAD have we finally arrived at the sample size needed to query genetic prevalence. For yet other diseases, we are still not there yet, but we may be soon. Therefore I expect that in the coming years we’ll see a lot more studies using gnomAD or other genetic datasets to estimate how common a disease is. Which makes now a good time to consider how to do this right.
the risk of circularity and interpretation
Your first question may be, isn’t this approach circular? Allele frequency is one factor used in deciding whether a genetic variant is pathogenic [Richards 2015], and disease prevalence is one factor used in deciding what allele frequency cutoff is reasonable [Whiffin & Minikel 2017]. So isn’t it circular to then add up the allele frequencies of pathogenic variants in order to estimate disease prevalence?
I would argue that circularity is a risk that one should be aware of, and much of this post will address what that awareness should entail, but I will argue that the specter of circularity does not as a blanket rule preclude this approach entirely. That’s because, done right, assertions of pathogenicity should be based primarily on strong lines of evidence that are orthogonal to allele frequency. Such lines of evidence will often include Mendelian segregation or de novo status, and depending on your disease and your gene, might also include things like functional annotation and behavior in in vitro or cell culture systems. As I’ve argued in my guide to using allele frequency, a variant’s frequency in the population should be just a filter to throw out the most obvious false positives or low-penetrance variants, and often, you’ll find that the variants thrown out by this approach were those that didn’t actually have strong evidence for pathogenicity to begin with [Minikel 2016].
issues to consider
penetrance and prevalence
All that being said, allele frequency information is only informative about how common a disease is, to the extent that you are confident about the penetrance of all the genetic variants being included.
To see why this is so, first consider the simplest case: all cases of a disease are attributable to a single genetic variant, and that variant always causes the disease. Here, the lifetime risk in the general population is equal to the frequency of the disease-causing genotype. We’ll call these variables P(D) for probability of developing disease, and P(G) for probability of disease-causing genotype. For allele frequency p, this means that for a recessive disease, P(D) = P(G) = p2. For a dominant disease, P(D) = P(G) = 2p(1-p) ≈ 2p, or, if heterozygotes are fertile and homozygotes viable, P(D) = P(G) = p2 + 2p(1-p) ≈ 2p.
Next suppose that the variant is not fully penetrant, but instead has penetrance between 0 and 1 denoted by P(D|G), meaning, probability of developing disease given the causal genotype. Now, instead of just P(D) = P(G), we have P(D) = P(G) × P(D|G).
Finally suppose that not all cases of the disease are attributable to just a single variant either. Now we have to also consider the proportion of disease cases explained by the variant, denoted P(G|D), for the probability of having this particular genotype given the disease state. Our equation now becomes P(D) = P(G) × P(D|G) / P(G|D).
So we find ourselves looking at Bayes’ theorem! Or, simply a rearranged version of the formula we used to calculate penetrance in [Minikel 2016], introduced in this post. Or, if you plug in 2p or p2 for P(G), and divide P(G|D) into separate terms for genetic and allelic heterogeneity, then you have a rearranged version of the formula we used for allele frequency filtering described in [Whiffin & Minikel 2017]. In other words, there is nothing new here. We have just performed some simple algebra to isolate the variable of interest. In [Minikel 2016] we isolated penetrance, P(D|G), in [Whiffin & Minikel 2017] we isolated genotype frequency, P(G), and now in this blog post we’re talking about isolating P(D). If you know three of the variables, you can estimate the fourth.
But there’s the rub — to solve the equation, you can only have one unknown. In practice, there’s usually some uncertainty around one of the input variables, so instead of determining with certainty the output variable, you can only put some bounds on it.
For instance: prion disease is well-enough surveilled that we are reasonably confident about lifetime risk in the general population. You could convince me that prion disease is under-diagnosed by half, but you couldn’t convince me it is under-diagnosed by 30-fold, which is what it would have taken to explain the frequency of supposedly disease-causing variants in the population. Therefore, given case and population control allele frequency information, we could estimate penetrance [Minikel 2016] — only roughly and on a log scale, but that was enough to change clinical practice. For allele frequency filtering, we left the uncertainty up to the user, inviting people to set conservative limits on what values they would believe for disease prevalence and proportion of cases attributable to a variant, and a minimum penetrance that they cared about, and then computing a loose upper bound on what allele frequency was plausible [Whiffin & Minikel 2017].
When we think about estimating how common a disease is, we’re not too worried about the proportion of cases attributable to any one particular variant, P(G|D), because we are going to sum across a number of variants. If the disease has been well-enough studied for the most common causes to have already been identified, then collectively the variants we include in our analysis will explain most cases. Mathematically, this is equivalent to saying P(D) = Σ P(G) × P(D|G) / P(G|D), and ΣP(G|D) ≈ 1. There’s an “if” there, of course, and I’ll return later to the question of which variants are being included. But assuming we’ve included enough of the right variants, we can eliminate the P(G|D) term and simply say that P(D) = Σ P(G) × P(D|G), or in other words, lifetime risk of our disease in the general population is the sum, over all causal variants, of the frequency of the disease-causing genotype times the penetrance. What the advent of large population control genetic datasets has done, then, is simply to give us a reasonable empirical estimate of allele frequency and thus P(G), so that now we are down to two unknowns: P(D) and P(D|G). Commonness and penetrance. To the extent that you know one, you can estimate the other.
And this is not a case where one can just hand-wave and say, “well, the few best-studied variants in my disease appear to be highly penetrant, so I’ll assume they all are.” Because when we say penetrance or P(D|G), we’re not only talking about whether a variant confers 99% versus only 80% disease risk — what really kills your analysis is the variants where penetrance is zero, or close to it, because the variant is not confidently associated to disease in the first place. Such variants can be a majority of reported variants in a gene — for instance, for PRNP we found that only 27 out of 70 reportedly disease-causing variants had evidence for Mendelian segregation or a de novo as basis for an assertion of Mendelian disease risk [Minikel 2018]. But worse still, it’s very likely that any variants you include that are not truly causal, or confer only very low risk, will have a much, much higher allele frequency than the truly causal variants in your dataset. To see why, we turn to the allele frequency spectrum.
allele frequency spectrum
Most human genetic variants are extremely rare, and we are continuing to realize just how much this is the case. In the early days of sequencing small datasets, on the order of 100 people, it was found that about 90% of variants are common (>1% allele frequency), but the larger the dataset, the more the frequency distribution skews rare, such that in gnomAD the majority of variants are singletons, seen just once in 141,456 people. One intuition for why it should be so is that, based on DNA mutation rates [Samocha 2014, Lek 2016], we estimate that of all possible SNPs, most that are compatible with life probably exist in some human somewhere in a heterozygous state — that’s three possible mutations per base, at 3 billion base pairs in the haploid genome, so on the order of 9 billion unique variants in almost 8 billion people. But we still have not seen most of those variants, so they must be very rare globally (though a handful may be common in some population we just haven’t yet sampled).
So most variants in gnomAD are singletons, corresponding to a nominal allele frequency of 3 × 10⁻⁶ and a true allele freuency likely lower, and most variants on Earth are rarer still. And if most variants in general are rare, pathogenic variants skew yet rarer still, because they are under pressure from purifying selection. Thus, even if false positives were to account for only a small fraction of unique variants (and in fact they may account for a large fraction), the fact that they are not under purifying selection means they are likely to be enriched for variants that, even though still below some pre-specified allele frequency cutoff, could be many times more common than your true causal variants. Thus, there exists a risk that a small number of false positives could account for the vast majority of cumulative allele frequency and for a dramatic inflation in any prevalence estimate you derive.
As an example, say you were applying this approach to prion disease (and for simplicity of example, say you’re using global and not population-specific allele frequencies in gnomAD). You might assume 1 in 5,000 risk in the population, most common variant causes 5% of cases, plug in numbers and settle on a maximum tolerated allele count of 6 globally in gnomAD v2, corresponding to an allele frequency of about 1 in 50,000, for variants of at least 50% penetrance. That would filter out the most common variants that are obviously either benign or very, very low-risk, such as P39L, E196A, and R208H — so far so good. But it would still leave in, for example, S97N, V203I, and Q212P, which collectively have an allele count of 10, and none of which have evidence for Mendelian segregation. Compare this to E200K, the most common cause of genetic prion disease and the only variant with evidence for Mendelian segregation with prion disease that does appear in gnomAD — it has an allele count of just 1. This illustrates that even with a fairly aggressive allele frequency filter, those variants that may not be truly associated to disease, or that may be much less penetrant than the assumption you put into the allele frequency cutoff calculation, can very quickly outnumber confidently disease-associated alleles by 10 to 1.
In other words, the allele frequency spectrum means that we need to be very careful about what variants are included in the analysis — so let’s turn to that topic next.
which variants to include
It’s not trivial to identify which genetic variants to include in an analysis to estimate disease commonness. That’s because fact that a variant has been reported as pathogenic — in ClinVar or in a Google Scholar search or in any other database I’ve seen — is neither very sensitive nor very specific for true pathogenic variants.
Reportedly pathogenic variants are a place to start, but unfortunately, you need to curate them. ClinVar has things like different levels of review and different numbers of submitters and assertion criteria provided or not provided, and to be sure, these are helpful. But so far I have not seen many genes for which the curation captured in ClinVar is so deep that a hard filter on just these existing annotations would be adequate. The best approach is to go back to primary scientific literature (and, if your gene has any variants asserted in ClinVar but never published, the original assertion criteria provided). First consider the potential criteria for pathogenicity outlined by the American College of Medical Genetics in [Richards 2015] and think about which criteria make sense biologically for your disease and your gene. Once you’ve decided what you’re looking for, set up a spreadsheet and go through every variant that’s been published. For prion disease, we decided the only credible criteria for assertions of high risk were Mendelian segregation with three affected individuals in one family, or de novo variants, and we found 27 of 70 variants had one of these [Minikel 2018]. You might also visit the allele frequency app to decide on a maximum credible allele frequency and then check this against gnomAD, but probably this will merely serve to increase your confidence that you were right to throw out many variants based on your literature curation. If you find that your filter is actually throwing out variants that did have good evidence for assertions of pathogenicity, then you have to consider whether A) the criteria you settled on make sense for your gene, B) any of your assumptions were wrong, or C) you are in fact discovering evidence that your disease may be more common than you thought.
The next question is which, if any, variants to include that have not previously been reported as pathogenic. It is virtually certain that there are pathogenic variants in your gene out there in the world that have not yet been published or have not yet even been seen in a case, and (particularly for recessive diseases) it’s reasonably likely that some of these may appear in gnomAD. But how to sift these out from the heap of benign variants in gnomAD? The answer is that it’s hard. In some genes where loss-of-function is a well-established disease mechanism, it may be appropriate to include loss-of-function variants seen in gnomAD in your calculation, with caveats. First, these should be nonsense, frameshift, and essential splice site only, and rated as high-confidence LoF. Second, you should curate the variants, especially any with higher allele frequency than the others — look at screenshots of the raw reads to make sure the variant call is real, look at the pext track in gnomAD to make sure the affected exon is actually expressed in your disease-relevant tissue [Cummings 2019], look at UCSC genome browser to make sure you believe the annotation as loss-of-function is real, and investigate any suspiciously non-random positional distributions of LoF variants across the coding sequence [Minikel 2019]. This is all because again, as explained above, even if just one or a few false positives were to sneak in, they might have a far higher allele frequency than genuine LoF variants.
One thing you should never do is to include missense variants never reported as pathogenic on the basis that they are predicted to be deleterious. Unfortunately, as of 2019, our ability to interpret missense variants is just not good enough to use them in this way. There are various tools for predicting which missense variants are deleterious — SIFT, PolyPhen, and CADD are the best-known. These tools do enrich for pathogenic variants in the aggregate — for just one line of evidence, see Figure 2E from [Lek 2016], which shows that the missense variants that PolyPhen and CADD predict to be worst have higher MAPS scores, meaning they are more often singletons, held at low allele frequency by purifying selection, than the variants predicted to be benign. But because of the allele frequency spectrum issue discussed earlier, enriching for pathogenicity in the aggregate is not good enough — if even a few benign variants sneak in, they will dominate the analysis. This is especially true for genes that are not missense-constrained — Figure 3F of [Lek 2016] shows that for the least missense-constrained genes, even PolyPhen “probably damaging” or CADD “high” missense variants are on average barely above synonymous variants in terms of their MAPS scores.
interpreting allele frequency
Next, you need to consider the interpetation of the allele frequency data themselves. Here, the issues to consider are very different for dominant versus recessive diseases.
For dominant diseases, to the extent that you assume the variants in question are penetrant, you are assuming that the people in gnomAD with those variants actually have, or will develop, the disease. Note that, per the gnomAD FAQ:
We have made every effort to exclude individuals with severe pediatric diseases from the gnomAD data set, and certainly do not expect our data set to be enriched for such individuals, but we typically cannot rule out the possibility that some of our participants do actually suffer from your disease of interest.
Thus, if your dominant disease is severe, and pediatric onset, then gnomAD allele frequency is not a sound basis for estimating how common your disease is, because gnomAD should be quite depleted for individuals with the disease. If your dominant disease is adult onset, then you could be in business, but with caveats. The median age of people ascertained in gnomAD is something like 55, so if you’re talking about a disease that is fatal at age 50, you should expect gnomAD to be significantly depleted for causal variants. Conversely, if your disease presents with a phenotype specifically ascertained in any of the cohorts included in gnomAD, then causal variants could be enriched. These sorts of caveats will differ for every dataset — 23andMe, UKBB, and so on — but in general it is a good idea to think about who is in the dataset and whether allele frequencies for your disease can be accurately estimated.
For recessive diseases, the issues involved are different, because your calculation will be based overwhelmingly on heterozygous carriers rather than people with the disease-causing genotype. Thus, questions of who is in the dataset and whether your disease phenotype is enriched or depleted do not come into play. But, questions of population structure start to matter more. You’ll presumably be adding up the cumulative allele frequency of all causal variants and then squaring it to arrive at an estimate of homozygote and compound heterozygote frequency. In that act of squaring, there is an opportunity to get pretty different answers depending on how you assume people choose mates. You might have one variant much more common in a particular population, such that the cumulative allele frequency is 0.02% overall in gnomAD, but 0.01% in Europeans but 0.05% in East Asians. Squaring 0.02% may not be meaningful, instead, the conclusion may be that you expect there to be just a handful of affected individuals of European ancestry across North America and Europe, but a few hundred affected individuals in China. There is no doubt that one needs to think about this in terms of populations, but where to stop — is East Asian good enough? Do you need to know if the carriers of your variant are indeed Chinese? And from which province? Or what if the population where a pathogenic variant is most common has a high rate of consanguinity — is p2 still a good estimate of homozygote frequency, or do you need to account for autozygosity? On these issues, all I can say is you have to consider these issues and do the best you can with available data, concluding what you can conclude and caveating what you can’t.
Another situation that arises, though, is where the population in which pathogenic alleles are most frequent is a population where the disease has never been well-studied, and the variant in question has only been seen in one or two cases. Here, you have to redouble your efforts to curate and be dead certain whether you believe the evidence for pathogenicity of that variant. It’s possible that you’ve just discovered that your disease is way more common in South Asia than anyone ever guessed, and now that you know where to look for more patients, within a few years you’ll be part of an awesome international consortium gathering valuable new natural history data and preparing for clinical trials. But it’s also possible that the one variant driving that allele frequency in South Asia is just not highly penetrant, or perhaps, for example, is only penetrant when found in trans to an even worse allele, whereas it does not cause disease in a homozygous state. In such cases, unless the evidence for the one variant is rock solid, I’d interpret the results to mean “this would be very interesting if true, and therefore motivates studies to see if this variant is indeed penetrant and whether this disease is indeed common in population X”.
which variants account for most cases
Earlier, I noted that the formula relating penetrance and prevalence also contains a term for the proportion of cases caused by a given variant, P(G|D). I made the simplifying assumption that, summed over all the variants in consideration, this is close to 1. I’ll now explain that assumption a bit more. Under “which variants to include”, above, I argued for pretty strict filtering based on literature evidence for pathogenicity, and for not including much or anything in the way of “predicted” pathogenic variants, so it is certain that not all disease-causing variants will be included, so that ΣP(G|D) does not quite get to 1. Why am I OK with this?
Most importantly, at the end of the day, you’re going to have wide confidence intervals around your estimate of disease commonness anyway, so if you only include variants explaining 90% or 80% or even 60% of cases, you’re in decent shape — that’s a much better outcome than including a bunch of “predicted” pathogenic variants that are actually benign, and ending up with an estimate that is inflated by 10-fold.
Moreover, it’s often the case that just a few pathogenic variants explain a large fraction of cases, and these are usually the variants that get discovered first when a disease is characterized — the long tail of variants discovered later often does not add a ton to cumulative allele frequency. In prion disease, just three variants — E200K, P102L, and D178N, all discovered in 1989 - 1992, explain 85% of cases with a high-risk variant [Minikel 2018]. Or to raise a more recent example, by far the most common LoF allele in NGLY1, R401X, with allele frequency an order of magnitude higher than any other, was seen in the very first patient identified [Need 2012, Enns 2014]. Why is it often the case that one or a few variants explain a large fraction of cases? One reason is that different DNA mutations arise at very different rates [Samocha 2014, Lek 2016]. CpG transitions (C→T where the adjacent base is G) occur spontaneously 10 times more often than other transitions (such as T→C), and 100 times more often than transversions (such as T→A). There are other PRNP mutations that are just as terrible but far less likely to arise spontaneously, whereas E200K, P102L, and D178N are all CpG transitions that have recurred many times in human history. Another reason in recessive diseases is simply drift: if pathogenic variants are rare, then pathogenic genotypes are squaredly rare, and so the variants in question are not under very intense natural selection, so one such variant may happen to get a bit more common than the others. A third reason is population bottlenecks, which allowed a few pathogenic variants to rise to unusually high frequency in populations like Finns and Ashkenazi Jews.
I could only think of one example where a variant explaining a significant fraction of cases was discovered late — COL6A1 was identified as a disease gene over 20 years ago (see OMIM #120220) but a single variant explaining 25% of unsolved cases (a smaller fraction of total cases) was discovered only in 2017 [Cummings 2017]. That’s because it was a deep intronic variant with a novel mechanism of creating a pseudoexon, and it was identified only by RNA-seq.
There could certainly be more instances like COL6A1, but I’m still more comfortable underestimating disease commonness by a bit than taking the risk of over-inclusion — especially since a variant like that one in COL6A1 would never have turned up as “predicted” pathogenic anyway. But certainly, the potential that common, undiscovered variants are out there is a caveat that might need to be made for some disease genes if you are trying to use allele frequency to estimate commonness.
As an aside, a related question that sometimes arises is whether and how allele frequency data can be used to figure out which pathogenic variants account for most cases of a disease. Suppose, for instance, that you’re Vertex Pharmaceuticals 20 years ago, just starting to find hit compounds that can rescue the phenotype of gating mutations in CFTR, and you want to know which compounds are most advanceable clinically based on which ones rescue variants with enough patients to run a trial. Here, what you really want is a registry or a case series, but often you don’t have that. A review of published cases in the literature is helpful, though it could be biased in either direction — maybe more common mutations are over-published because there is a large enough N to write a paper about, or maybe rarer mutations are published because of the novelty factor. You might then turn to allele frequency data from gnomAD or elsewhere, and you may be able to get an answer, but all the same caveats from this post will apply. For diseases too rare to even yet get a reasonable allele frequency estimate from gnomAD, your best guess may simply come down to mutation rates — all else being equal, if there are two known pathogenic variants and one is a CpG while the other is a transversion, the CpG is the one you’re more likely to see again. (Some indels such as short tandem repeats can also have rather high mutation rates [Ballantyne 2010]).
conclusions
Overall, I believe that estimation of disease prevalence (or incidence, or lifetime risk) is an important topic and, for many diseases, we still know too little. Allele frequency information from population databases such as gnomAD provides a new opportunity to estimate how common a disease is, and does not result in too much circular reasoning provided that pathogenicity assertions are based on good evidence orthogonal to allele frequency. But there are a lot of caveats to consider, hence, the following call-out box summarizing suggestions I’ve made above:
|
A few suggested guidelines for using allele frequency information to estimate how common a disease is.
I would love to see a consensus from the genetics community over the coming years on whether and how this sort of study can be done right. I welcome comments on whether this all sounds reasonable, and what other guidelines or considerations you would suggest.

About Eric Vallabh Minikel
Eric Vallabh Minikel is on a lifelong quest to prevent prion disease. He is a scientist based at the Broad Institute of MIT and Harvard.