The natural history of prion disease in mice
What is the sequence of molecular and symptomatic events in prion-infected mice? This seems to be a question so old, you would think we should have definitive answers by now, and yet, new studies on this topic continue to reveal new results. This blog post will dive into some of the latest in detail.
Why do we care? Unlike many other neurodegenerative diseases, prion disease has excellent animal models. Indeed, even calling them models is a stretch — mice infected with prions actually develop fatal disease, and many mammals are natural hosts of prion disease. Important variables like brain size and lifespan certainly differ between mice and humans, but in key molecular senses, prion disease in a mouse is the same disease we see in humans. That’s not something that can be said for mouse models in a lot of other diseases, and it’s an enormous asset to our field. Extrapolating from timepoints in a mouse to timepoints in a human will always involve a lot of guesswork, but in thinking about how results of mouse studies inform on the prospects for human therapeutics, it would be great to at least have some sentinel landmarks in hand. When are the mice sick? When do they show molecular evidence of pathology?
If it seems like the answers to these questions ought to be trivial, they aren’t. Papers describing preclinical therapeutic studies in mice will often claim that a drug was given after the onset of symptoms, without any evidence (or any convincing evidence) that said symptoms were present. This is an issue I have critiqued again and again on this blog. Sometimes the issues come from extrapolating between experimental paradigms — the course of prion disease depends upon prion strain, infectious dose, route of infection, what PrP amino acid sequence is expressed, and the expression level thereof. But even for the most commonly used, tried-and-true model — wild-type mice infected with 30 μL of a 1% RML brain homogenate — there is surprising variability in when the mice are judged to be sick. Within any one cohort of animals in one investigator’s hands, the variability is low — standard deviation is typically a week or less — so it doesn’t seem to be random variability, but rather, systematic variation in how the mice are assessed and what criteria are used to judge symptom onset.
On one hand, I worry that wishful thinking, unblinded experiments, and confirmation bias might lead researchers to think they see symptoms too early — before any symptoms are truly present. On the other hand, there are also reasons to suspect researchers might denote symptoms too late — long after more subtle changes have already appeared. That’s because in a disease model with really obvious symptoms in late-stage disease (ataxia, tremor, weight loss, death), investigators might not bother to look for more subtle early signs. In addition, the infectious nature of prions means that researchers often don’t have access to the sophisticated behavioral testing suites that might be used to characterize other mouse models.
Meanwhile, there are also important distinctions that sometimes get overlooked when people are summarizing their results. One is between group-wise differences versus individual differences. A group of prion-infected mice might start to look different on average from uninfected mice at one timepoint, and it might be statistically significant, and yet it could still be days or weeks before an observer could look at any one mouse and say, this one is sick. Another distinction is between molecular versus phenotypic changes. Mice may exhibit neuroinflammation, neuronal damage, and prion accumulation, detectable by histology or even by assays in live animals, and yet still be weeks or months away from any overt behavioral changes.
Dr. Deborah Cabin, our wonderful collaborator at McLaughlin Research Institute, recently led a thorough study to characterize the natural history of prion disease in that most commonly used animal model: wild-type female C57BL/6 mice intracerebrally infected with 30 μL of a 1% brain homogenate. The full results are described in our recent joint publication [Minikel 2020, Figure 3-4], but here I’ve attempted to distill the key findings down to a single panel:
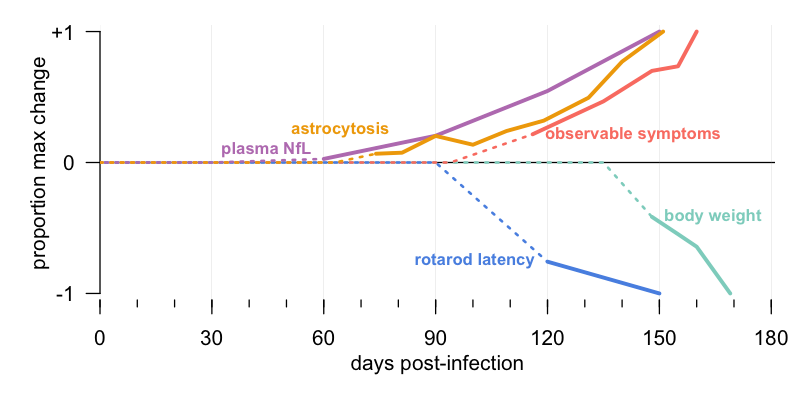
This is actual data being plotted, not just a conceptual diagram. To get from all the individual data points behind this figure to the simple image you see here requires several layers of inference, and if you want to understand every step, read the full paper or see the source code that I wrote to produce this figure. But at a high level, here’s the explanation. For many of these metrics, such as weight, animals differ from one another at baseline. Therefore, animals are first normalized to their own individual baseline. For many, there is also age-dependent change — for example, animals gain weight and get worse at rotarod as they get older. Therefore, animals are next normalized to the uninfected control group. Even after these steps, there is enough random variability that the mean value may drift around without the drift being statistically significant. Therefore, I snapped to zero all observations that were not even nominally (P < 0.05) significant, as well as those where nominal significance transiently appeared but went away at later timepoints. Some of these measures may change by just ten percent (say, weight) in the time that others change by over ten fold (say, NfL), so to visualize them all on the same y axis, I divide each measure’s change by its maximum change ever achieved. Last of all, many measures were only assessed every 30 days, and the linear interpolation inherent to this sort of plot can make it look like a difference has appeared before it really has, so I used dashed lines to indicate times before any significant difference was observed.
The result of all this is a plot that is very highly abstracted from the source data, but, I hope and think, manages to convey a meaningful and accurate impression at one visual glance. The key findings are as follows.
Molecular changes come first. Plasma neurofilament, a marker of neuronal damage, begins to exhibit a small but detectable rise at about 60 days post-infection. (That’s a group-wise average — it wasn’t evident in every individual animal until 90 dpi, as shown in Figure S6). This is in line with results from the Prusiner lab / Daiichi Sankyo collaboration that were presented at Prion2019 [Hirouchi 2019]. Astrocytosis, as measured through bioluminescence live animal imaging, begins to rise around 73 dpi. This is a bit later than some others have reported — the first study of bioluminescence imaging in prion-infected mice saw changes as early as 55 dpi [Tamguney 2009]. Either way, these sorts of molecular markers of neuronal damage and neuroinflammation both come early. As I’ll discuss more below, the NfL data provide an interesting contrast to the longstanding “two-phase” hypothesis in prion disease, which has held that neurotoxicity begins only when prion replication stops and symptoms begin.
Symptomatic changes come much later. Decline in rotarod performance was not significantly different from controls, group-wise, until 120 dpi. Symptom counting — subjecting the mice to behavioral tests and observations — didn’t reveal changes until at least 116 dpi. And weight loss, the clearest and most objective measure, was latest of all, kicking in at 148 dpi.
This study certainly was not exhaustive. The investigators didn’t look at every possible metric and outcome, didn’t do mazes or memory tests or burrowing, and didn’t do automated behavioral monitoring based on continuous video feeds. Some investigators have reported that the earliest signs of disease are to be found in these more complicated readouts [Mallucci 2007, Steele 2007]. It’s possible we missed something. On the other hand, the multiple testing burden explodes when you monitor all those different outcomes, and even above, many of the changes we show are only nominally significant at the earliest timepoints. Therefore, while I certainly don’t rule out the possibility that there are subtle symptomatic changes prior to about 115 or 120 dpi in these mice, I think one thing we can say for sure is, it is difficult to observe such changes.
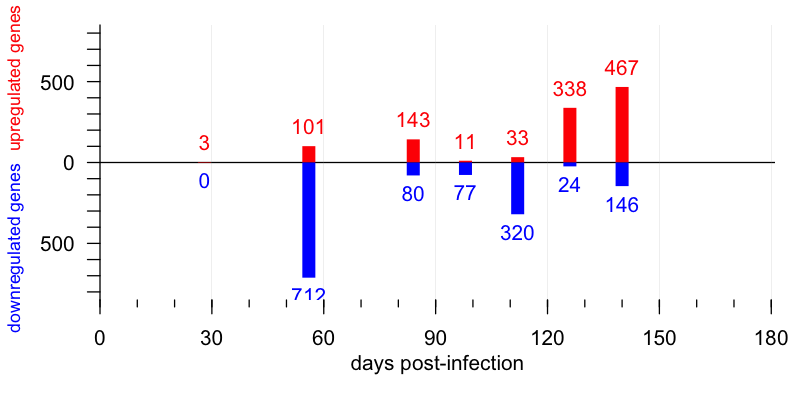
Another view into the natural history of prion infection in mice comes from a recent report from the Aguzzi lab [Sorce & Nuvolone 2020]. The focus is on reading out gene expression changes in the brain through RNA-seq, but there are a ton of other data here as well. This study used almost the exact same model as Dr. Cabin’s study, but with a 10-fold lower titer prion inoculum (30 μL of a 0.1%, instead of 1%, RML brain homogenate) and with males instead of females.
In terms of gene expression in the brain, this study found appreciable changes beginning at 56 dpi. At this timepoint, 101 genes were upregulated, falling mostly into “cluster 1” which contained a lot of microglial and astrocytic genes, suggesting these cells were mounting a neuroinflammatory response. This is right in line with a prior study that used microarray [Hwang 2009]. That earlier study had likewise identified mostly neuroinflammatory genes turning on at early timepoints, and it nominated Gfap, a marker of astrocytosis, as one of the earliest gene expression changes in the prion diseased mouse brain. That helped inspire the use of bioluminescence to track this marker in live animals [Tamguney 2009]. In addition to these upregulated genes, though, the new study also identified a cluster of downregulated genes at 56 dpi as well. These genes were large in number (712 of them), were mostly neuronal (“cluster 4”) and had largely recovered at 84 dpi. Thus, this downregulated spike appears to represent some sort of transient neuronal response to prion infection.
At present, it is unclear what this cluster of genes represents. Are these genes really “downregulated” per se, or do they correspond to (for instance) mRNAs physically localized in dendrites or axons that are being destroyed? If so, why would their recover later in the disease course? A fascinating area for future research will be to see whether any of these differentially regulated genes at 56 dpi correspond to any potentially translatable biomarkers, such as proteins whose concentration in cerebrospinal fluid might drop once prions begin replicating in the brain.
The new study also monitored rotarod performance to try to detect the earliest moment when the mice became symptomatic. They had much denser sampling than our study did, testing every 2 weeks beginning at 56 dpi and every 1 week beginning at 112 dpi. With all this vigilance, they still did not observe changes in rotarod any earlier than Dr. Cabin’s study did. Rotarod latency dropped slightly, but not significantly, at 126 dpi, and reached nominal (P < 0.05) significance at 133 dpi. They also had a blinded observer perform neurological scoring on the animals, and by this metric, they were deemed “symptomatic” at 126 dpi.
This study also quantified prion titers in the brain at a series of timepoints using RT-QuIC and scrapie cell assay (Figure S6). The latest two timepoints were 112 dpi and terminal, which was a median of 176 dpi. The titer was found to be higher at 176 than at 112 dpi by both methods. The authors therefore argue that “prion titers never reach a plateau but continue to rise until the terminal stage of disease.” This ties into a longstanding controversy. Prusiner declared nearly 40 years ago that prion titers plateau at the onset of illness [Prusiner 1982], but as I’ve reviewed here, the underlying data were a bit more ambiguous. Prusiner’s own study [Baringer 1983] actually did show a nominal, albeit small in magnitude, increase in titer in multiple regions of hamster brain between 48 and 71 dpi (roughly corresponding to disease onset and terminal disease respectively), and some studies since then have observed at least some increase in titer during the symptomatic phase in hamsters as well, by both bioassay and RT-QuIC [Kimberlin & Walker 1986, Orru 2012]. A more recent series of papers focused on mice, and using scrapie cell assay as the readout, displayed a more clearly flat plateau beginning around symptom onset [Sandberg 2011, Sandberg 2014], and argued that prion replication and neurotoxicity are therefore two distinct phases of disease.
The Aguzzi lab argues that this two-phase hypothesis is now refuted, based on both an increase in prion titer during the symptomatic phase, and their observation of neuron-specific gene downregulation as early as 56 dpi. My take is that the new data are consistent with the overall picture from earlier studies that the so-called “plateau” may not in fact be perfectly flat. Given that 112 and 176 dpi were the only sampled timepoints, their data don’t rule out some sort of plateau emerging at some later point, or at least, that the slope at which titer increases may decline a bit as symptoms set in. I do agree, however, that the two-phase model now seems too simplistic. The Aguzzi lab’s observation of a distinct cluster of neuronally downregulated genes at 56 dpi [Sorce & Nuvolone 2020], together with the observation by us and others that plasma NfL begins to increase as early as 60 dpi [Minikel 2020, Hirouchi 2019], argues that prion neurotoxicity is in fact ongoing long before symptom onset, before the pace of prion replication has slowed at all.
At the same time, an added layer of complexity lies in considering what we mean by neurotoxicity. Our study also showed that the increase in NfL is partially reversible by ASO treatment, at least up to 120 dpi [Minikel 2020, Figure 4], and there is some reason to believe (discussed here) that NfL better reflects axonal damage rather than outright neuronal loss. One alternative grouping would be to consider three phases: truly silent prion replication (~0-60 dpi), prion replication with neuronal damage and neuroinflammation and attendant molecular evidence of pathology but no symptoms (~60-120 dpi), and outright neuronal loss and outwardly observable symptoms (~120+ dpi). Granted, perhaps as we gain more insight into the timing of these processes the grouping into “phases” will not make sense at all, and we will think of it as a continuous cascade of changes.
What any of this means for translating timepoints in mouse experiments into humans remains to be seen. Sonia and I have argued before that there are two patient populations in human prion disease [Vallabh 2020]. Symptomatic patients tend to be diagnosed only after profound dementia and readily observable symptoms, at which point all manner of biomarkers of disease are also wildly elevated. Pre-symptomatic patients at genetic risk, on the other hand, are cross-sectionally almost all completely normal, with no symptoms nor any biomarker evidence of pathology [Vallabh 2019]. These folks may not even be at the equivalent of mouse 0 dpi — the first prion may not have formed yet. Thus, the time from about 60 to 120 dpi in a mouse, when pathology is detectable but symptoms are not, may actually correspond to a disease stage that in humans is very brief, such that relatively few patients are in this state at any given time.
Overall, has the picture of prion disease in mice changed? Yes and no. Decades ago, someone studying prion disease in mice could have told you that symptoms are observable around maybe 120 or 130 dpi, but that if you are willing to cut their brains open and if you know what to look for, you can see pathological changes starting maybe as early as 56 dpi [Diedrich 1991]. In that sense, our view of the basic kinetics of prion disease has not changed. However, new molecular methods such as plasma NfL measurement and brain RNA-seq have brought some changes that I believe are real and meaningful. First, we can now see some of those pathological changes in live animals and track their progression in real time. Second, we can get molecular resolution — rather than just saying we see astrocytosis, we can point to specific astrocytic genes that are upregulated, and this may in turn lead to translatable biomarkers down the road. Third, while we might not see pathological changes any earlier than we did before, we can see more and different pathological changes. So whereas the old thinking was that astrogliosis begins early but neuronal damage occurs late, new methods show us changes in neuronal gene expression and evidence of neuronal damage quite early on as well. That may change how we think about the phases of disease.

About Eric Vallabh Minikel
Eric Vallabh Minikel is on a lifelong quest to prevent prion disease. He is a scientist based at the Broad Institute of MIT and Harvard.