Study design for therapeutic trials in FFI and E200K mice
introduction
Yesterday I connected with George Carlson at McLaughlin Research Institute to discuss what a study design could look like for therapeutic trials in two newly arrived knock-in mouse models of fatal familial insomnia (FFI) and E200K Creutzfeldt-Jakob Disease (CJD) [Jackson 2009, Jackson 2013]. This post will discuss considerations for therapeutic trials in these mouse models, focusing on the FFI mice because they are better characterized.
motivation for study
One of our research goals at Prion Alliance is to take compounds that have shown efficacy against prions in vivo and validate them in models of genetic prion disease. The same PRNP mutations that cause genetic prion disease in humans are capable of causing spontaneous prion disease with strikingly similar phenotypic and biochemical properties in mice [Jackson 2009, Yang 2009, Jackson 2013]. We believe this is a clue that these mutations give rise to accurate models of the human disease. This is important because many anti-prion compounds prove to be strain-specific, and there are now two recent examples of compounds that worked against RML prions but not against human sCJD prions: 2-aminothiazoles and cpd-B [Lu & Giles 2013 (ft)]. Moreover, while as argued here, early treatment of prion-infected mice is not an accurate model of therapeutic scenarios for sporadic prion diseases, early treatment of genetic mouse models may be a realistic scenario for prophylactic treatment of asymptomatic human carriers.
phenotypic readout
The FFI and E200K mice are currently being crossed to Tg(GFAP-luc) mice [Zhu 2004] which express luciferase under the GFAP promoter, allowing live animal imaging of GFAP upregulation, a marker of astrocytosis and therefore of disease stress in the brain. The increase in bioluminescence is an accurate proxy for prion replication in the brain [Tamguney 2009] and has recently been validated as a proxy for the therapeutic efficacy of an antiprion small molecule, cpd-B [Lu & Giles 2013 (ft)].
Bioluminescence imaging (BLI) is important as a readout for the FFI mice because, unlike some other models of prion disease, most do not develop terminal illness. They do have progressive symptoms of temperature dysregulation, sleep disruption, neuronal loss in the thalamus and astrocytosis, consistent with human FFI [Jackson 2009] but many of these phenotypes are difficult or labor-intensive to monitor, or cannot be assessed on an ongoing basis while the mice are alive.
variability
Because these knock-in lines have not been used for therapeutic studies before, the distribution of times to endpoints is not well-established. As a guideline, Walker Jackson provided us with these notes on histopathology in several of the mice. Mice were examined at timepoints ranging from 13 to 19 months and all had at least some degree of gliosis in the thalamus (though two are labeled as “mild” or “little”), and many also had it in the cerebellum. He also stated that all the mice examined prior to 12 months had been negative.
Because the notes don’t form a systematic time series of data points, it is difficult to estimate the range of ages of onset of gliosis in these mice. However, if it’s true that all prior to 12 months are negative and all after 14 months are positive, then the standard deviation can be no greater than one month because, given a fixed range of data, variance is maximized when a distribution is perfectly bimodal at the min and max, i.e. all 12s and 14s:
sd(c(rep(12,1000),rep(14,1000)))
[1] 1.00025
In practice, the variance might well be greater than that, for two reasons. First, we do not yet know what degree of gliosis will be required in order to show up in BLI. Second, mice used in therapeutic studies will be on an impure genetic background. Tg(GFAP-luc) mice are maintained on an FVB/N background and the FFI mice are currently on a 129 background (mixed 129/S4 and 129/S2). After crossing these two lines and then re-crossing to obtain homozygotes, the offspring will be F2s with ~50% FVB/N and ~50% 129 background. That will increase variability compared to using pure inbred mouse lines. The FFI knock-in gene causes later, milder phenotypes in Black 6 mice than in 129 mice [Walker Jackson, personal communication] and we can’t predict what the effect in FVB/N will be. On the plus side, one advantage of the mixed background is that it will help to show that any therapeutic effects are not limited to one strain of mice.
power calculations
I will use the t test for these power calculations, as I’ve argued is appropriate. If we assume for a moment that the onset times are normally distributed with a mean of 13 months and a standard deviation of 1 month, a study with n = 15 mice per group would be 80% powered at p < .05 to detect a delay in onset of at least 8% (~1 month) in the treated group:
> power.t.test(n=15,delta=NULL,sd=30/395,power=.8,sig.level=.05)
Two-sample t test power calculation
 n = 15
 delta = 0.08048967
 sd = 0.07594937
 sig.level = 0.05
 power = 0.8
 alternative = two.sided
NOTE: n is number in *each* group
That’s not a ton of power for, say, statins, which have been observed to have an effect size of 5-12%, but it’s quite ample for anle138b, which nearly doubled survival time when given at 0 dpi and extended survival by 30% even when given at timepoint ~0.66 (see anle138b post).
Indeed, even if my back-of-the-envelope above is wrong and the standard deviation in the FFI mice is much larger – say, 90 days – we’d still have 80% power for at least a 24% delay in onset:
> power.t.test(n=15,delta=NULL,sd=90/395,power=.8,sig.level=.05)

     Two-sample t test power calculation

              n = 15
          delta = 0.241469
             sd = 0.2278481
      sig.level = 0.05
          power = 0.8
    alternative = two.sided

 NOTE: n is number in *each* group
And thus still be amply powered (~93% at p < .05) for a 30% delay, let alone a larger delay.
So far I haven’t modeled here the fact that mice are only observed at regular intervals for BLI and so the exact date of onset is not known. This turns out to matter surprisingly little, as I’ll show in my next post. In the meantime, here is an R script that does take this into account, assumes weekly imaging sessions and simulates power for this study as a function of the standard deviation of onset in the FFI mice, with four curves for different hypothetical effect sizes: 10%, 30%, 44% and 97% delay in onset (the latter three values are based on results for anle138b against RML). The script produces this plot:
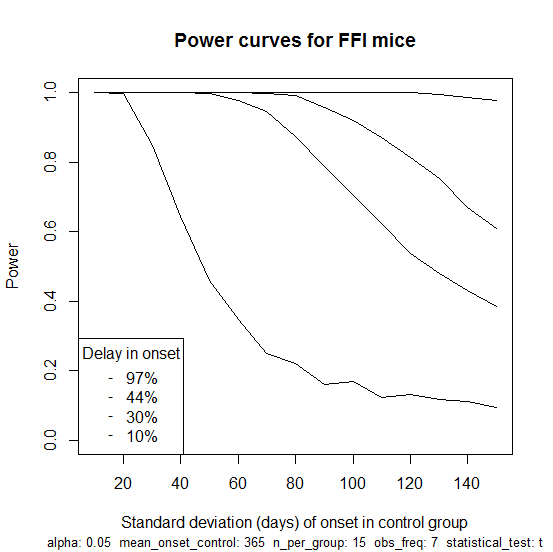
Which illustrates how the study would not be well-powered to detect an effect size of just 10% unless the variance in age of onset is on the low end of what we think it might be. But for a 30% delay (the second curve from bottom) there is a good amount of power until you get to about 90 days standard deviation. For a 97% delay (the top curve), you’re basically guaranteed to see a significant result no matter how large the variance. This plot goes up to a standard deviation of 150 days, which is certainly more than the true value, since a normal distribution with that much variance would imply many mice with ages of onset below zero or beyond the lifetime of mice; even a uniform distribution from 6 months to 18 months would give a standard deviation of only 100 days.
cost structure
Here is the full spreadsheet summarizing the cost structure that Dr. Carlson described. We assumed the following parameters:
- n = 15 mice per group
- 2 genotypes (FFI and E200K)
- 2 groups per genotype (treated from weaning and untreated control)
- Study duration 1.5 years
- BLI beginning at 6 months and lasting for one year.
Below is a broad summary of costs for this scenario assuming weekly BLI monitoring.
| item | cost |
|---|---|
| Cage space | $2,500 |
| Food | $3,100 |
| Luciferin | $9,400 |
| Labor | $5,200 |
| Indirect | $14,100 |
| TOTAL | $34,300 |
Note that this is for one hypothetical study design. Update: we’ve now announced a revised budget for which we will be fundraising through Prion Alliance.
I was surprised to learn that luciferin ends up being so expensive. Luciferin is the small molecule that luciferase breaks down in order to release light. Every time the mice are imaged, they need to be injected with 1.5 mg of luciferin (“50 μl of 30 mg/ml D-luciferin potassium salt solution” [Lu & Giles 2013 (ft)]) at a cost of about $3 each. Times 60 mice times weekly imaging sessions for a year, this ends up being the largest direct cost. see update
Of note, 100% of costs are directly proportional to the number of mice, and > 80% of costs (luciferin, labor and indirect) end up being proportional to the total number of BLI sessions, i.e. to the frequency with which mice are monitored by BLI. Therefore while it’s important not to have an underpowered study, it’s also important not to have an overpowered study, as the costs could be reduced considerably by having fewer mice and/or monitoring them less frequently. Therefore my next post will address the issue of statistical power in BLI studies and will argue that reducing the frequency of imaging sessions can reduce costs considerably with virtually no loss of statistical power.
Note that we have not included costs for drugs, as we are presently discussing a trial of anle138b as a follow-up to our current trial of this compound in GSS mice. Dr. Armin Giese and Dr. Christian Griesinger have offered to provide this test compound for free a second time.
risks and tradeoffs
A major risk of launching a therapeutic study immediately is the possibility of an uninterpretable result. Because we have not yet seen how gliosis presents on BLI in FFI knock-in mice, it is possible that the signal will be too weak to detect or will come much later than expected. Because we do not yet have hard data on the distribution of times of onset in FFI mice, the variance may be greater than expected, and thus the statistical power of a study less than expected (though as I’ll show shortly this is not much of a concern for reasonable effect sizes).
The safest way to proceed towards therapeutic trials in these mouse models would be to backcross the Tg(GFAP-luc) transgene onto 129 background. To obtain (1-.56) = ~98% purity would require 6 backcrosses, at ~2.5 months each, thus 15 months. A pilot study of 10-15 mice would also need to be monitored until at least 14 months, possibly longer, using BLI in order to establish the distribution of ages of onset of gliosis in order to perform power calculations for therapeutic studies. This pilot study could be conducted concurrently with the backcrossing, using mixed FVB/N / 129 mice, or ideally would be conducted afterward using the > 98% 129 mice.
All of that would delay the start of therapeutic trials by ~15 – 30 months. In addition, it would cost more than half as much as a therapeutic study itself, since the BLI pilot study would essentially consist of monitoring only control groups and no treated groups (thus ~half the cost) and the six-generation backcrossing of mice would consume additional space and resources.
For these reasons, Dr. Carlson observed that, counterintuitively, it might actually be a more efficient use of time and money to start therapeutic trials immediately. I call this counterintuitive because to proceed with a preclinical trial when you can’t yet do a firm power calculation or be certain you’ve got a viable phenotypic readout seems rash on first glance.
But on closer look, it may actually be the most cost effective option. Suppose doing pilot study would cost about 0.5x the cost of a therapeutic study, as I’ve argued above. The two outcomes are yes it works, now let’s do a therapeutic study for 1.0x (total cost: 1.5x) or no it doesn’t work, back to the drawing board (total cost: 0.5x). If you go straight to a therapeutic trial and yes the study design works, great (total cost: 1.0x) and if no it doesn’t, too bad (total cost: 1.0x). So if you believe that the probability of yes is > 50%, then it’s actually more cost-effective to do the therapeutic trial right away, even if you don’t value calender time at all. And we do value calendar time: a therapeutic trial could start in early 2014 and give results by mid-2015, while doing a pilot study first would mean no therapeutic results until at least the end of 2016.
conclusions
Based on our discussions, launching therapeutic trials of anle138b in FFI and E200K knock-in mice in early 2014 seems feasible. While a study with a reasonable number of mice (say, 15 per group) would not be well-powered for drugs of small effect size, it should be adequate for the magnitude of effect size (> 30%) shown previously for anle138b [Wagner 2013].
The greatest risk of such a study is the possibility of an uninterpretable result if the phenotype in control mice proves difficult to assess by BLI due to too low a level of luminescence or too late or variable an onset of gliosis on the mixed genetic background of 129 and FVB/N. However, conducting a pilot study first to rule out these risks would be costly itself, and would delay the start of trials by probably a year and a half. Overall, this study would be more risky than our current trial of anle138b in GSS mice, but still looks like a fairly sensible option given our commitment to launching trials in these mouse models eventually.
The biggest issue will be the cost, which according to the parameters assumed above would be considerably more than the current GSS trial, particularly when NIH-fundable indirect costs of 70% are included. However, because the number of imaging sessions is a major cost driver, reducing the frequency of imaging may be able to reduce costs considerably. My next post will tackle the question of how this would affect statistical power.

About Eric Vallabh Minikel
Eric Vallabh Minikel is on a lifelong quest to prevent prion disease. He is a scientist based at the Broad Institute of MIT and Harvard.