Antisense part IV: pharmacokinetics and cell biology
This post is fourth in a series of posts on the science of antisense oligonucleotides as therapeutics.
In this series I’ve introduced antisense oligonucleotides (ASOs), described their various mechanisms of action, and the chemical modifications employed to make them drug-like. In writing this post, I will seek to understand two closely inter-related topics: pharmacokinetics and cell biology — or in other words, where ASOs go in the body and what happens to them, and where ASOs go in the cell and what happens to them. This is a subject on which the literature is vast, and after hours and hours of reading I have still only scraped the surface, but it’s a subject important enough that I am going to make a best effort to summarize the key points I’ve learned in a blog post.
pharmacokinetics of peripherally delivered ASOs
For the past couple of decades, most ASOs tested clinically have been delivered peripherally — outside the central nervous system, that is, usually intravenously or subcutaneously. The pharmacokinetics of these peripherally administered ASOs have been studied and reviewed extensively [Bennett & Swayze 2010, Geary 2015].
For the commonly used MOE PS oligos (see chemistry post for what those are), the concentration of ASO in the bloodstream following a therapeutically relevant dose may start out at >10 of μg/mL of plasma (about 2 μM), and within a day it drops to just 0.01 μg/mL (about 2 nM) [Geary 2015]. This initial, rapid, phase of clearance from plasma is driven by the drug circulating around bound to plasma proteins, progressively coming off of those proteins and going into tissue — mostly the liver, although some potency can be observed in a wide range of tissues [Hung 2013]. There then begins a second, slow, phase of clearance, where over the course of weeks, drug comes out of tissues such as liver, and back into the bloodstream where it gets taken up by the kidney and excreted in urine. The kidney apparently scavenges and excretes the non-protein-bound ASO in plasma, because the degree of plasma protein binding is reported to be a major determinant of the rate of kidney excretion. While MOE PS oligos are highly protein-binding, some other ASO chemistries, especially those with uncharged backbones such as PMOs (again, see chemistry), exhibit much less plasma protein binding, and thus more rapid elimination through the kidney, competing with liver or other tissue uptake in that initial rapid phase and thus limiting their potency.
If liver and kidney are the two tissues with the strongest biodistribution of ASOs, drug development for these two organs has been a bit lopsided. A great many peripheral ASOs, such as the approved drug mipomersen against APOB [Raal 2010], are designed against liver targets [Bennett 2017]. In contrast, I haven’t seen as much in the way of ASO development for kidney diseases — Googling it, I found just one example, IONIS-AZ5-2.5Rx, against an undisclosed target. And it seems ASOs do not merely pass through the kidney on their way to excretion in the urine — they do actually go into cells and engage RNA targets in the kidney. A survey of Malat1 knockdown across organs in mice and monkeys after ASO administration found that a MOE ASO that gave 95% knockdown in liver also gave 72% knockdown in kidney [Hung 2013], and cEt ASOs, which are more potent thanks to their conformational locking, could achieve over 90% knockdown in kidney. I took the monkey cEt ASO from [Hung 2013] and plugged it into Jesper Maag’s gganataogram Shiny app to produce this plot showing the % knockdown (blue is 0% knockdown, yellow is 100% knockdown) across tissues, mapped from monkey onto a human:
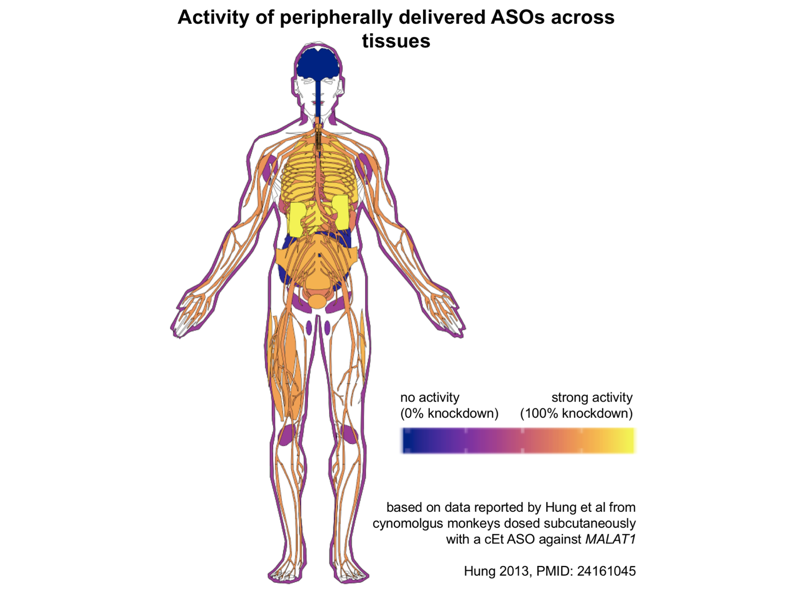
As you can see, from peripherally delivered ASOs, you get no activity in the CNS, and next to none in colon or pancreas (those are the dark blue blobs at back center). The bright yellow representing strongest activity by far is liver and kidney, but in the oranges to purples you see a smattering of modest activity, 30-70% knockdown, across almost all peripheral tissues tested, including everything from skin to peripheral nerves to skeletal muscle to many different central organs.
A decade ago, it was discovered in animals that the same dose of the same ASO was more potent if given in a single bolus subcutaneous injection than if given in a gradual subcutaneous infusion over days [Geary 2009]. Indeed, it seemed that if the peak plasma concentration or Cmax was below 1 or 2 μg/mL you got very little ASO activity, and above that threshold you suddenly got quite good activity. You can imagine many possible explanations for this phenomenon — for example, maybe there is a particular blood protein that binds ASOs and has high affinity but low abundance, and so acts as a non-productive “sink” for some of the ASO does, and you need to saturate this sink before you get any productive uptake. However, a clever series of experiments suggested that the problem is actually that the target tissue cells themselves have both productive and non-productive pathways — I will address this further in the cell biology section below.
pharmacokinetics of intrathecally delivered ASOs
The earliest studies of ASOs for brain diseases used a slow infusion of ASOs into spinal fluid. In mice, this meant delivery over a few weeks using osmotic pumps implanted in the skull [Smith 2006], which was not so well-tolerated — for instance, about half the mice died after pump implantation in the first study of ASOs for prion disease [Nazor Friberg 2012]. In a human trial of an ASO against SOD1, they used a half-day-long infusion [Miller 2013], which seemed well enough tolerated, but it wasn’t yet clear how durable of action it would give rise to. That one human study used a low dose of ASO and they did not observe a clear decrease in CSF SOD1 concentration [Miller 2013], in contrast to the large decrease observed in rats treated with anti-SOD1 ASOs [Winer 2013], and also in contrast to the 37% knockdown of CSF SOD1 observed in a more recent SOD1 ASO trial.
A turning point in the development of ASOs for the CNS was the discovery that bolus dosing of ASOs in one large injection gave a superior brain distribution of ASO, in addition to being well-tolerated and easier to do [Rigo 2014]. This seems to mirror the findings from peripherally dosed ASOs [Geary 2009] — for whatever reason, there is a threshold of Cmax (here, peak drug concentration in CSF) that you need to ovecome in order to get good potency. Like in the periphery, this may be due to distinct cellular uptake pathways, discussed further below in this post.
Nowadays, then, ASOs for central nervous system (CNS) disorders are delivered in a bolus dose intrathecally (IT; through a lumbar puncture, also known as a spinal tap) in humans and in non-human primates, and by stereotactic intracerebroventricular (ICV) injection in mice. The human autopsy data from patients treated with ASOs are still sparse (thankfully — it seems people treated with drug are surviving!) but the limited available data show both ASO uptake and pharmacodynamic activity across the CNS, including in cortex and in thalamus [Finkel 2016].
The pharmacokinetics of intrathecal, bolus-dosed ASOs in humans have been studied in the Phase I clinical trials of both nusinersen for spinal muscular atrophy and RG6042 for Huntington’s disease [Chiriboga 2016, Tabrizi 2019]. In both cases, the bolus dose of ASO corresponds to a high initial concentration of drug at the moment of injection. For instance, the highest tested dose of RG6042 was 120 mg, and adult humans only have about 100 - 150 mL of CSF, so the CSF concentration immediately post-dose must have been about 1 mg/mL, or on the order of 150 μM. Nusinersen was dosed at up to 9 mg in infants, so a similar picture. By one week post-dose, both ASOs had dropped more than five orders of magnitude, to about 3 ng/mL (about 0.5 nM) in CSF. Where did they go? In each case, much or most of the drug was rapidly cleared out of the CSF and into plasma, with plasma concentration peaking a few hours post-dose. Plasma concentration then dropped about 3-fold by 24 hours and, for nusinersen, dropped below lower limit of quantification (1 ng/mL, about 0.15 nM) within a week after dosing. But of course, the reason these ASOs are potent in the CNS is that not all of the drug is cleared into plasma — some of it goes into brain parenchyma. The ASO that reaches brain cells then much more gradually equilibrates back into CSF, resulting in a much longer half-life for terminal elimination of the drug — on the order of 4-6 months.
Until more human autopsy data come in, our best guess at the activity distribution of intrathecally delivered ASOs across the brain still comes from pharmacokinetic/pharmacodynamic models based on dosing studies in animals, so I spent some time trying to understand those models a bit more. The supplement of [Tabrizi 2019] describes the model for the huntingtin-lowering drug candidate for Huntington’s disease, RG6042. In living humans, one knows the dose being injected, and one can measure the concentration of drug in CSF, and the concentration of the target protein, here mutant huntingtin (mHTT) in CSF. From these values they wanted to 1) predict what doses will give what percent protein knockdown in CSF (before the trial starts), and 2) use protein knockdown in CSF to infer protein knockdown in different brain regions (both before the trial and after you have the measurements). In principle, in cynomolgus monkeys, one should be able to inject known doses and correlate them to CSF drug concentration, CSF protein knockdown, brain RNA and brain protein knockdown, thus relating all variables of interest. In practice, they used monkeys but also transgenic mice for two practical reasons. First, it’s not realistic to study enough monkeys to establish dense enough data points for some of these relationships. Second, in the case of RG6042, the drug candidate itself has a sequence mismatch to monkey HTT, so they tested drug concentrations in monkeys using the real drug but they tested knockdown in monkeys using a surrogate, modified version of the drug specific to the monkey sequence. While not all of the data are shown, the upshot is that they closely predicted the 40% knockdown of mHTT in human CSF seen at the highest dose in the trial, and they believe this corresponds to 55% knockdown in cortex (which is substantially affected in Huntington’s, and well-reached by ASOs) and 20% knockdown in striatum (the hardest-hit region in Huntington’s, but more difficult to reach with ASOs).
cell biology of ASOs
Up to now I’ve talked about the pharmacokinetics of ASOs in terms of their uptake into tissue, but what does that really mean? It actually means uptake of ASOs into cells, a process I’ll spend the rest of this blog post trying to get my head around.
This is an interesting topic because it is kind of surprising that ASOs get into cells at all. Consider, for contrast, siRNAs. Like ASOs, siRNAs are short (21 base) nucleotide sequences designed to be antisense to a target RNA. But, as explained in my post about the first RNAi drug, siRNAs do not get into cells on their own — they have to be either conjugated to, say, a sugar chain that promotes uptake, or formulated in a lipid nanoparticle, or something else. When people use siRNA as a research tool in cell culture the lab, they usually either deliver it into cells by transfection (encapsulation in cationic lipids such as lipofectamine) or electroporation (pulsing electric current to open temporary holes in the cell membrane).
So how do ASOs get into cells? The short answer is by binding proteins. Whereas unmodified DNA or RNA molecules, such as siRNAs, have more limited protein binding, most ASOs are formulated with a phosphorothioate (PS) backbone, which makes them more hydrophobic and more protein-binding, as reviewed in my ASO chemistries post. At last count, over 60 different proteins had been identified as binding partners of ASOs, many with nanomolar affinity [Crooke 2017]. The different 2’ sugar modifications used in ASOs can affect their binding affinity, but so can sequence — for at least one ASO-binding protein studied in detail, P54nrb, the affinity of ASOs with the same chemistry, differing only in sequence, can vary by more than 100-fold [Vickers & Crooke 2016].
But how exactly does protein binding get ASOs into cells, or at least, to where they need to be in cells? Many of the ASO-binding proteins are located on the cell surface, and it appears that after ASOs bind, they get internalized through endocytosis [Crooke 2017]. Multiple different endocytosis pathways seem to be capable of internalizing ASOs, including clathrin- and caveolin-dependent pathways. But endocytosis only gets ASOs into endosomes, which are membrane-bound vesicles, so the ASO is still walled off from the cytosol and the nucleus, the two compartments where they are active [Liang 2017]. Somehow, we need endosomal escape — ASOs must get out of endosomes and into the cytosol. From there, ASOs can be active right in the cytosol, but can also undergo carrier-mediated transport through the nuclear pore and into the nucleus (and back out again) [Lorenz 2000], apparently by binding specific transporter proteins.
In this whole process, the endosomal escape step seems to be the part we know the least about, but what we do know is fascinating. At a high level summary, ASO uptake can be categorized into productive uptake — uptake that leads to endosomal escape and ultimately pharmacodynamic activity — and non-productive uptake — uptake that leads to accumulation in intracellular compartments without any pharmacological activity. The latter accounts for the majority, probably the vast majority of all ASO uptake, suggesting a lot of room for technological improvements to enhance ASO potency.
There are several different lines of evidence supporting the existence of distinct productive and non-productive pathways, and indicating that most ASO uptake is non-productive [Crooke 2017]. For example, one study in cell culture [Alam 2010] compared the uptake and activity of the same fluorophore-labeled ASO with or without a tripeptide conjugate that had been shown to bind a cell surface receptor (αvβ3 integrin) and promote a particular endocytosis pathway [Alam 2008]. For the same given level of intracellular uptake of ASO, the level of RNA target engagement (in this case, read out by a luciferase splice reporter assay) was two-fold higher for the conjugated ASO than the unconjugated, suggesting that not all uptake is created equal. The conjugated ASO could be blocked by inhibitors that didn’t affect the unconjugated one, further showing that there were two distinct pathways. One indication that similar patterns were at play in vivo came from pharmacokinetic studies of subcutaneously dosed ASOs in the mouse liver [Geary 2009]. They found that bolus dosing, as opposed to slow infusion over days, resulted in greater potency despite less drug accumulation in liver tissue. They next did competition studies, where they injected a 30 mg/kg dose of active ASO in the presence of various doses (from 0 - 120 mg/kg) of an inactive ASO. As they injected more and more inactive ASO, uptake of the active ASO in the liver went down (by about 75%), just as you’d expect. But paradoxically, the potency of the active ASO went up — whereas it only achieved 60% knockdown on its own, it achieved 85% knockdown when paired with the inactive ASO. The interpretation was that the inactive ASO saturates the non-productive uptake pathway(s), forcing a greater proportion of the active ASO into a productive uptake pathway.
Many different receptor and adaptor proteins have been identified that appear to play some role in these uptake pathways. For instance, the protein AP2M1 appears to be important for a particular endocytosis pathway that leads to productive uptake [Koller 2011]. It appears that non-productive uptake mostly leads to accumulation of ASOs in lysosomes, whereas the ASOs destined for productive uptake escape from endocytic vesicles somewhere around the late endosome stage [Koller 2011]. Chloroquine, a tool compound that alkalinizes acidic compartments, actually blocks productive uptake, suggesting that the acidification along the path from early endosomes to late endosomes is somehow important for escape [Koller 2011]. But brefeldin A, another tool compound that blocks transport from the ER to the Golgi, also blocks productive uptake somehow [Koller 2011], and COPII proteins, which normally are involved in ER-Golgi traffic, can apparently re-route to late endosomes and facilitate ASO escape [Liang 2018]. Another protein, ANXA2, co-localizes with ASOs and appears to be involved in their journey from early endosomes to late endosomes for eventual escape [Wang 2016], and a phospholipid, lysobisphosphatidic acid, seems to be important for productive trafficking along the endocytic pathway as well [Wang 2017a]. The literature on this is vast, and I’ve only just scratched the surface of what is covered in reviews on the subject [Crooke 2017, Juliano 2018b]. But a lot is still mysterious. For example, it is not clear to me what exactly happens in endosomal escape. Do the late endosomes full of ASOs rupture and spill all their contents into the cytosol? Or are they disassembled in some more orderly fashion? Or do only certain patches of membrane flip from inside to outside, keeping the vesicle intact while sending select contents out into cytosol?
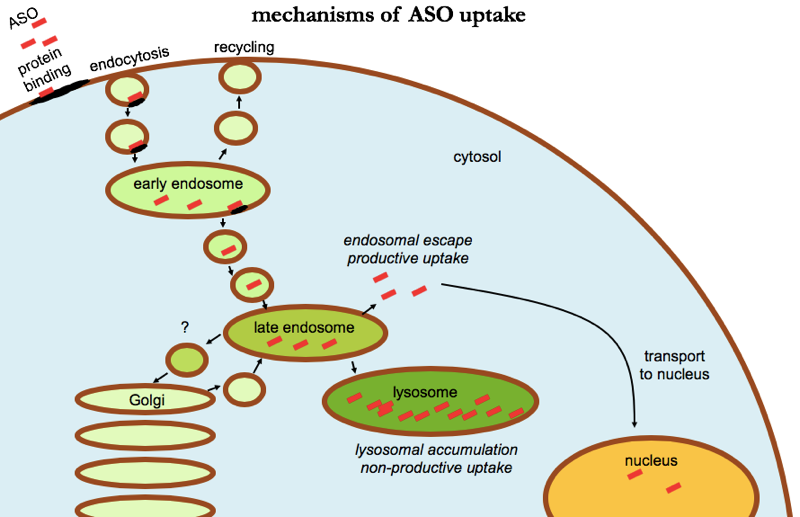
ASO uptake in cells. Uptake appears to involve binding to cell surface proteins leading to endocytosis. Most ASO accumulates in lysosomes, where it is in active — a “non-productive uptake” pathway. A minority of ASO escapes from late endosomes, reaching the cytosol and being transported into the nucleus as well, a “productive uptake” pathway.
Another mystery relates to the fact that most immortalized cell lines that people study in the lab only take up ASOs into a non-productive pathway. Screening of ASOs in cell culture, a first step to identify candidate sequences to advance in to mice, has therefore often been performed using lipofectamine as a transfection reagent. This is true, for example, in the first paper identifying PrP-lowering ASOs [Nazor Friberg 2012]. In other studies, people have used so-called gymnotic (“naked”; without transfection) screening systems [Skotte 2014], but this generally requires primary cultures, say, from transgenic mice, rather than immortalized cell lines. So there is some mechanism present both in primary cultures and in vivo that allows free productive uptake of naked ASOs, but that is lost in most cell lines. Equally surprising, different ASOs against the same target can vary enormously in how potent they are in vivo, in ways that aren’t fully explained by their different EC50 values identified in gymnotic cell culture screens — compare, for instance, the cell culture potency data in [Skotte 2014, Table 1] to the in vivo data in [Southwell 2014, Figure 3]. And once you talk about in vivo data, it’s important to remember that almost all studies are done using qPCR on bulk tissue to assess target engagement, so we are still largely blind to differences in cell type-specific uptake between different ASO sequences and chemistries. These are differences that may be lost in bulk tissue but could be hugely relevant for therapeutic efficacy in a disease that affects one cell type in particular.
If the majority of ASO uptake is non-productive, a corollary is that there should be a lot of room to increase the activity of ASOs without needing to increase their dose or even their total cellular uptake. One active area of research is to add conjugates to ASOs to promote productive uptake, and several lipid conjugates have been identified that appear to achieve this, apparently by increasing the rate of endosomal escape [Wang 2019]. Another active area is to identify small molecules that synergize with ASOs by shifting uptake towards productive pathways, and you can imagine that since ASOs can modulate splicing, this lends itself to a “gain of signal” luciferase reporter assay, which is a nice thing to have in small molecule high throughput screening campaigns. Hits identified to date seem to work by promoting escape from late or perhaps intermediate endosomes, and promisingly, they work in vivo [Yang 2015, Wang 2017b, Juliano 2018a]. It is tempting to imagine that for many of the ASOs being evaluated as potential first drugs for incurable diseases today, the second drug could end up being a more potent conjugated ASO, or a small molecule that synergizes with the ASO. That could be true, although as far as I know most of these approaches are still a fair ways away from clinical evaluation.
discussion
Many scientists, both in academia and industry, have devoted their careers to figuring out how ASOs work, and how to make them work better. For instance, the chemical modifications discussed in my last post in this series are the product of decades of research into improving ASO potency. Those chemical modifications help mostly by either increasing affinity for the target RNA, or by modulating protein-binding, and thus promoting ASO uptake into cells and/or letting the ASO stick around in plasma long enough to be taken up into cells. It’s thanks to those efforts that ASOs are now potent enough to work well in vivo after systemic or intrathecal administration, and to be a realistic modality for reaching large swaths of human tissue as drugs. But for all the progress that’s been made, we might still be only a fraction of the way to unlocking the true potential of ASOs. The pharmacodynamic activity observed with ASOs in vivo is probably mediated by just a tiny fraction of the dose, with most of the drug being lost to non-productive uptake, accumulating in lysosomes instead of being active in the cytosol and nucleus of the target cells. There is still a lot we don’t know about how exactly ASOs get to where they need to be, and unraveling these mysteries could help us learn to control ASOs’ ultimate fate and improve their potency. I come to this subject as an outsider seeking to understand what’s known, and in this blog post I certainly have not done justice to all the important research in this area, but hopefully I have gotten more things right than wrong. If you spot errors or omissions, please leave a comment below.

About Eric Vallabh Minikel
Eric Vallabh Minikel is on a lifelong quest to prevent prion disease. He is a scientist based at the Broad Institute of MIT and Harvard.