How compound incubation time affects power in anti-prion drug discovery screens
When I reviewed the different strategies used in anti-prion drug discovery recently, I noticed that the number of days that the test compounds were incubated with the cell cultures varied from 1 day to 6 days. I became curious about how the incubation time affects the assay’s ability to uncover compounds with different mechanisms of action. After all, PrP mRNA, PrPC and PrPSc each have their own half-life, so the further upstream you start inhibiting, the longer it takes for inhibition to percolate down to the assay’s readout.
By way of review, here is what we know about the half-life of these different molecules from the published literature.
Half lives of PrP mRNA, PrPC and PrPSc
| molecule | N2a cells | in vivo |
|---|---|---|
| PrP mRNA | 7h [Pfeifer 1993] | |
| PrPC | 5.2h [Borcheldt 1990 (ft)] 3-6h [Caughey 1989 (ft)] |
18h [Safar 2005 (ft)] 4.95 days [Price 2010] |
| sPrPSc | 36h [Safar 2005 (ft)] | |
| rPrPSc | 30h [Peretz 2001 (ft)] | 36h [Safar 2005 (ft)] |
rPrPSc = proteinase K-resistant PrPSc, aka PrP-res.
sPrPSc = proteinase K-sensitive PrPSc.
It makes me a little bit nervous that we still rely on studies more than 20 years old as the sole reference for the half-life of PrPC in cell culture. These studies, conducted before the world had proper monoclonal antibodies against PrP, used “anti-PrP peptide antiserum” [Caughey 1989 (ft)] and various rabbit antisera raised against PrP 27-30 [Borcheldt 1990 (ft)]. The authors do address shedding, but since no well-defined epitope was used we don’t know whether or not alpha cleavage may have contributed to the disappearance of PrPC in the chase. Second, given the genomic instability of long-cultured N2a cells, it’s certain that the N2a clones Caughey and Borcheldt were using are not quite the same N2a clones in use today. Different subclones of N2a can have dramatically different properties in terms of infectability, both overall and by specific strains [Mahal 2007] – we don’t know how much of that could have to do with ability to degrade PrPC or rPrPSc.
And here are the readouts and incubation times used in published high-throughput screens:
Compound incubation times used in high-throughput anti-prion drug discovery screens
| study | readout | incubation time |
|---|---|---|
| Kocisko 2003 | rPrPSc | 5 days |
| Bertsch 2005 | PrPC / PrPSc binding | N/A |
| Ghaemmaghami 2010 | rPrPSc | 6 days |
| Poncet-Montange 2011 | rPrPSc | 5 days |
| Leidel 2011 | rPrPSc | 5 days |
| Karapetyan & Sferrazza 2013 | PrPC | 1 day |
Simple model of half-life percolation
Based on the above literature review, I assumed half-lives of 7h for mRNA, 5h for PrPC and 30h for rPrPSc in N2a cells, which are the cell model used in all of the relevant screens. I considered six possible ways that compounds could act to reduce rPrPSc. Each of the following mechanisms would asymptotically produce the same 50% reduction in rPrPSc, but would get there at different rates. I’ve ordered them from slowest to fastest:
- A 50% reduction in mRNA transcription rate.
- A doubling of mRNA degradation rate.
- A 50% reduction in PrPC translation rate.
- A doubling of PrPC degradation rate.
- A 50% reduction in rPrPSc production rate (due to blocking binding, conversion, etc).
- A doubling of rPrPSc degradation rate.
I set out to model exactly how rPrPSc lags behind PrPC and how PrPC lags behind mRNA. Here’s the R script I came up with.
# Eric Vallabh Minikel
# CureFFI.org
# 2013-08-01
# R script to model how exponential decay percolates through PrP mRNA, PrPC and rPrPSc

# key point for this whole model:
# lambda, the parameter of exponential decay, is equal to ln(2)/halflife  see https://en.wikipedia.org/wiki/Half-life
# specifically,  tau = halflife/ln(2) = 1/lambda
# and at steady state, rate of decay = rate of production

# half life parameters in N2a cells
mrna_half_life = 7    # Pfeiffer 1993  http://www.ncbi.nlm.nih.gov/pubmed/8095862
prpc_half_life = 5    # Borcheldt 1990 http://www.ncbi.nlm.nih.gov/pubmed/1968466/
prpres_half_life = 30 # Peretz 2001    http://www.ncbi.nlm.nih.gov/pubmed/11507642

# parameters for 6 possible ways that PrP-res could be reduced - you can tweak these
transcription_rate_dec = 0.50 # decrease in transcription rate.     try 0.50
mrna_deg_rate_inc      = 0.00 # increase in mRNA degradation rate.  try 1.00
translation_rate_dec   = 0.00 # decrease in translation rate.       try 0.50
prpc_deg_rate_inc      = 0.00 # increase in PrPC degradation rate.  try 1.00
prpres_prod_rate_dec   = 0.00 # decrease in PrPSc production rate.  try 0.50
prpres_deg_rate_inc    = 0.00 # increase in PrPSc degradation rate. try 1.00
# the plot title should be changed to reflect the parameters you choose above
plottitle= 'Results of 50% increase in PrPC degradation rate' # make sure to change this when you change the parameters at top.

hrs = 8*24 # number of hours to bother modeling - I model out to eight days

# mRNA
mrna_prod_rate = log(2)/mrna_half_life * (1 - transcription_rate_dec)
mrna_deg_rate = log(2)/mrna_half_life * (1 + mrna_deg_rate_inc)
mrna_init = 1

mrna_deg = numeric(hrs) # mRNA degraded each hour
mrna_pres = numeric(hrs) # mRNA present each hour
mrna_pres[1] = mrna_init # initial condition
mrna_prod = rep(mrna_prod_rate,hrs) # mRNA produced each hour
for (i in 2:hrs) {
   mrna_deg[i] = mrna_deg_rate * mrna_pres[i-1]
   mrna_pres[i] = mrna_pres[i-1] + mrna_prod[i] - mrna_deg[i]
}

# plot just the mRNA
plot(1:hrs,mrna_pres,type='l',,ylim=c(0,1))

# PrPC
prpc_prod_rate = log(2)/prpc_half_life * (1 - translation_rate_dec)
prpc_deg_rate = log(2)/prpc_half_life * (1 + prpc_deg_rate_inc)
prpc_init = 1

prpc_deg = numeric(hrs)
prpc_pres = numeric(hrs)

prpc_pres[1] = prpc_init

prpc_prod = prpc_prod_rate * mrna_pres
for (i in 2:hrs) {
   prpc_deg[i] = prpc_deg_rate * prpc_pres[i-1]
   prpc_pres[i] = prpc_pres[i-1] + prpc_prod[i] - prpc_deg[i]
}

# plot mRNA and PrPC
plot(1:hrs,mrna_pres,type='l',col='red',ylim=c(0,1))
points(1:hrs,prpc_pres,type='l',col='orange')

# rPrPSc or PrP-res
prpres_prod_rate = log(2)/prpres_half_life * (1 - prpres_prod_rate_dec)
prpres_deg_rate = log(2)/prpres_half_life * (1 + prpres_deg_rate_inc)
prpres_init = 1

prpres_deg = numeric(hrs)
prpres_pres = numeric(hrs)

prpres_pres[1] = prpc_init

prpres_prod = prpres_prod_rate * prpc_pres
for (i in 2:hrs) {
   prpres_deg[i] = prpres_deg_rate * prpres_pres[i-1]
   prpres_pres[i] = prpres_pres[i-1] + prpres_prod[i] - prpres_deg[i]
}

# plot mRNA, PrPC and rPrPSc all together
plot(1:hrs,mrna_pres,type='l',lwd=1,col='red',ylim=c(0,1),ylab='normalized level',xlab='hours of incubation',main=plottitle,cex.main=.8)
points(1:hrs,prpc_pres,type='l',lwd=1,col='orange')
points(1:hrs,prpres_pres,type='l',lwd=1,col='purple')
legend('topright',c('rPrPSc','PrPC','mRNA'),col=c('purple','orange','red'),pch='-',cex=1)

# points for readouts measured by published compound library screens
points(1*24,prpc_pres[1*24],pch=19)  # PrPc at 1 day - measured by Karapetyan & Sferrazza 2013 http://www.ncbi.nlm.nih.gov/pubmed/23576755
points(5*24,prpres_pres[5*24],pch=19)# rPrPSc at 5 days - measured by Kocisko 2003, Leidel 2011, Poncet-Montange 2011
points(6*24,prpres_pres[6*24],pch=19)# rPrPSc at 6 days - measured by Ghaemmaghami 2010

# labels for points
text(1*24,prpc_pres[1*24],labels=paste(round(prpc_pres[1*24]*100),'% PrPC after 1 day',sep=''),cex=.5,pos=4)
text(5*24,prpres_pres[5*24],labels=paste(round(prpres_pres[5*24]*100),'% rPrPSc after 5 days',sep=''),cex=.5,pos=4)
text(6*24,prpres_pres[6*24],labels=paste(round(prpres_pres[6*24]*100),'% rPrPSc after 6 days',sep=''),cex=.5,pos=4)

# optional - plot total PrP
# total_prp = (prpc_pres + prpres_pres) / 2
# points(1:hrs,total_prp,type='l',col='black')
By plugging in a 50% knockdown of transcription in the parameters at top, I can generate the following plot:
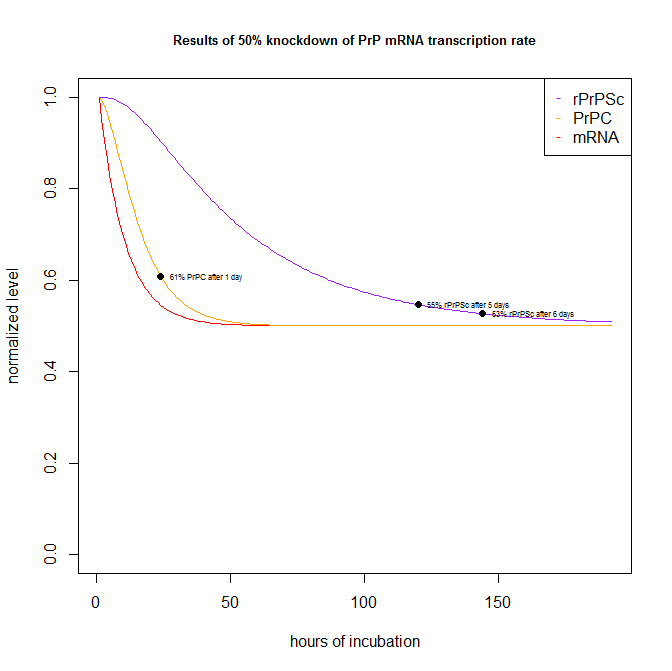
Which shows that a hypothetical test compound that knocks down PrP transcription by 50% would have shown up as 61% of PrPC (i.e. a 39% knockdown) after 1 day in the Scripps FRET assay [Karapetyan & Sferrazza 2013], and 55% of rPrPSc after 5 days and 53% of rPrPSc after 6 days in the ELISA dot blot assays.
That’s probably just about the worst case scenario – you can’t go too much further upstream than transcription, though of course you could imagine a molecule that impacts some slow signaling cascade leading to transcriptional change, which is something I’ve not modeled here.
By contrast, a compound that doubles the degradation rate of PrPC would show up in the assay readout even more quickly:
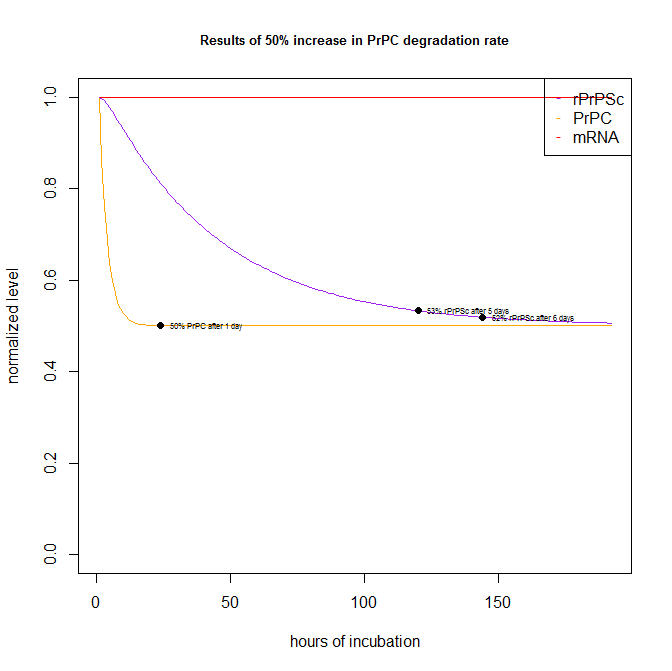
After just 1 day, PrPC has pretty much reached its asymptotic destination of 50% knockdown. rPrPSc is slower but gets to 53% and 52% of original level after 5 days and 6 days respectively.
I ran this script for each of the six possible scenarios, and here’s what the readouts look like:
| compound effect | PrPC after 1 day | rPrPSc after 5 days | rPrPSc after 6 days |
|---|---|---|---|
| 50% reduction in mRNA transcription rate. | 61% | 55% | 53% |
| Doubling of mRNA degradation rate. | 54% | 54% | 52% |
| 50% reduction in PrPC translation rate. | 52% | 54% | 52% |
| Doubling of PrPC degradation rate. | 50% | 53% | 52% |
| 50% reduction in rPrPSc production rate. | N/A | 53% | 52% |
| Doubling of rPrPSc degradation rate. | N/A | 50% | 50% |
conclusions
For most mechanisms of action, existing assays have long enough compound incubation times to be reasonably powered to detect inhibitory compounds given the half-lives reported in the literature. For the most upstream mechanism, inhibition of transcription, a bit of power is lost, but a 50% inhibition still results in a 39% reduction in PrPC after 1 day.
These figures are heavily dependent on the reported half-lives however. I tried plugging in 18h as the half-life of PrPC – that’s the value in vivo – and things got far worse, with a 50% inhibition of transcription resulting in 79% of PrPC (i.e. a 21% reduction). Hopefully the published values for half-lives in N2a cells are accurate and are indeed much lower than in vivo.

About Eric Vallabh Minikel
Eric Vallabh Minikel is on a lifelong quest to prevent prion disease. He is a scientist based at the Broad Institute of MIT and Harvard.